
Understanding your email analytics
Knowing how your emails are performing helps you figure out what's working, so you can keep doing more of it. Your email analytics show you how many people opened your email, who clicked your links, and much more, all in one place.
Overview
Your email analytics report gives you a full picture of how a specific email performed after it was sent. You can see delivery rates, open rates, click rates, and subscriber-level details, and take action on your list directly from the report.
How to view your email analytics
Go to your Emails dashboard.
Hover over any sent email (found under Status > Sent).
Click View Results.
What the analytics report shows
At the top of the report, you'll see an At a glance summary that includes:
The subject line
How many subscribers it was sent to
The date and time it was sent
Below that, a graph breaks down your email's performance across four key metrics:
Metric | What it means |
|---|---|
Sent | How many subscribers the email was sent to |
Delivered | How many subscriber inboxes it reached |
Opens | How many subscribers opened the email |
Clicks | How many subscribers clicked a link |
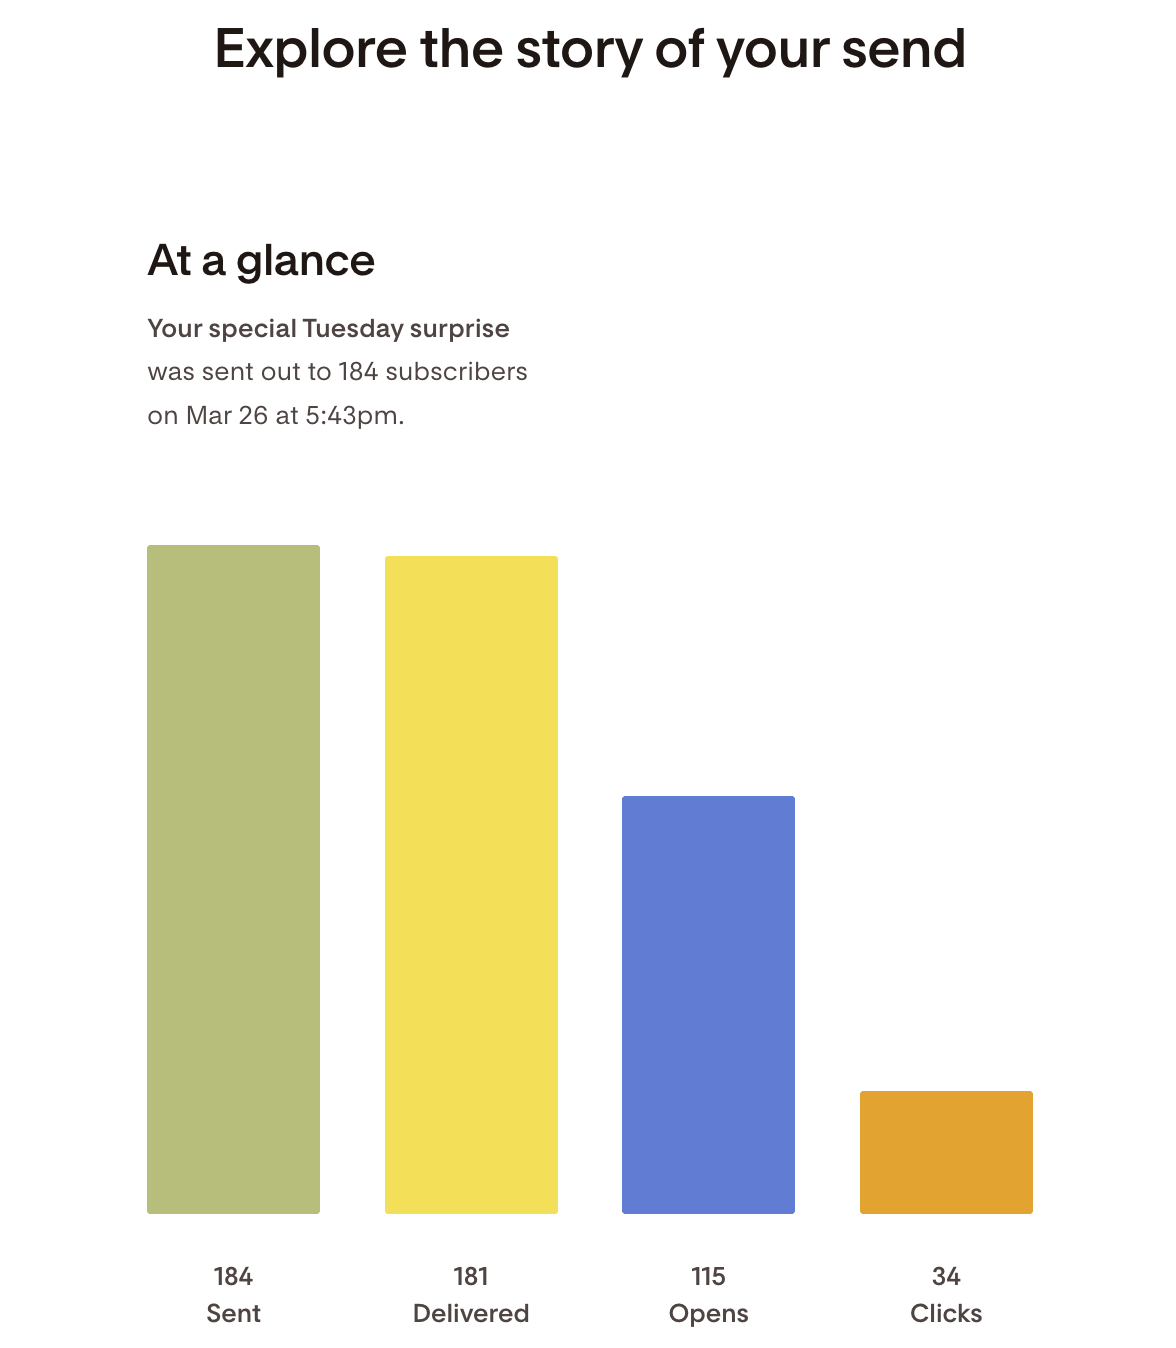
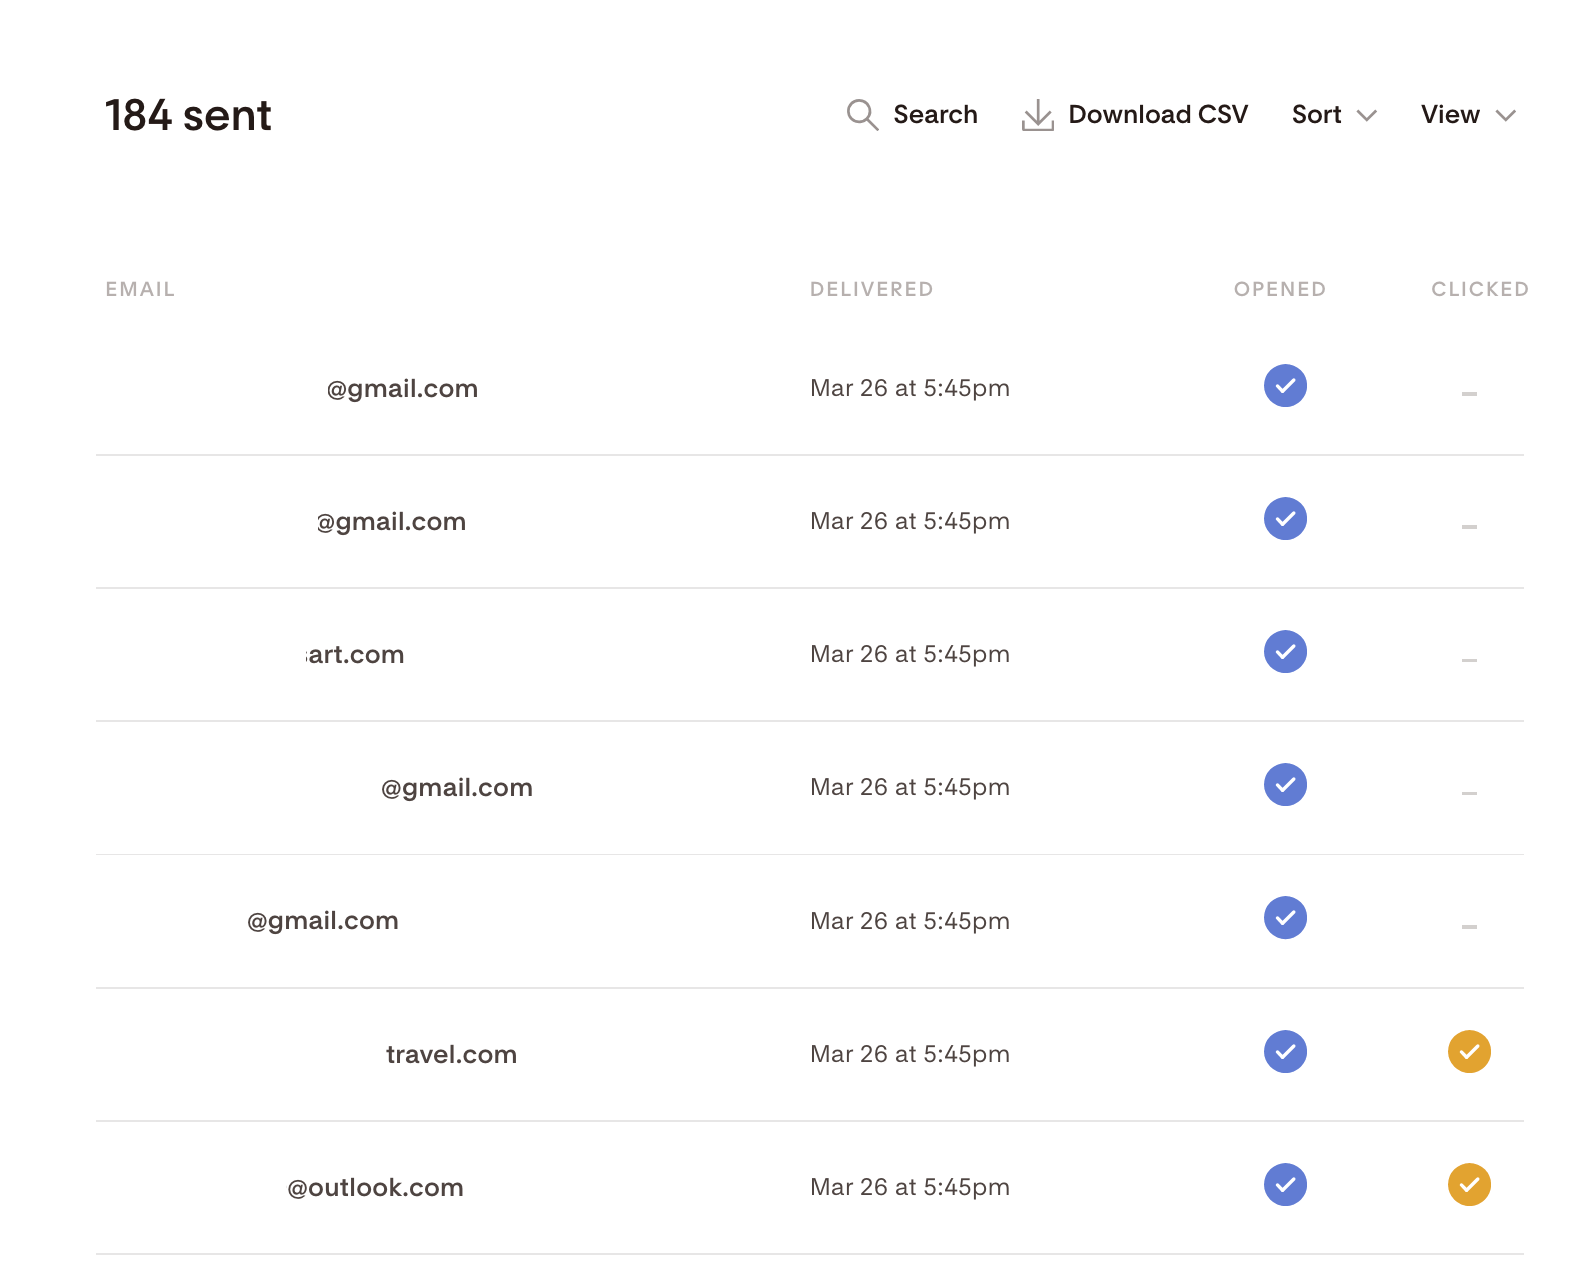
Click any bar in the graph to drill into the details. For example, clicking Sent shows you which subscribers the email was sent to, whether it was delivered, and whether it was opened or clicked.
Searching and filtering
Use the Search and Sort functionality to quickly find a specific subscriber's email address. You can also download a CSV report of the full send.
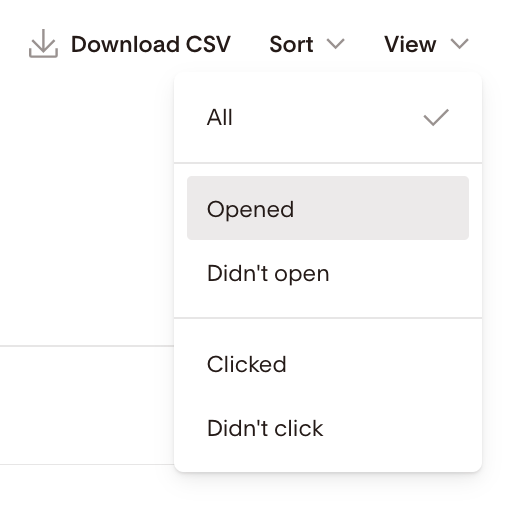
The View selector lets you filter by subscribers who:
Opened the email
Didn't open the email
Clicked the email
Didn't click the email
Bulk actions
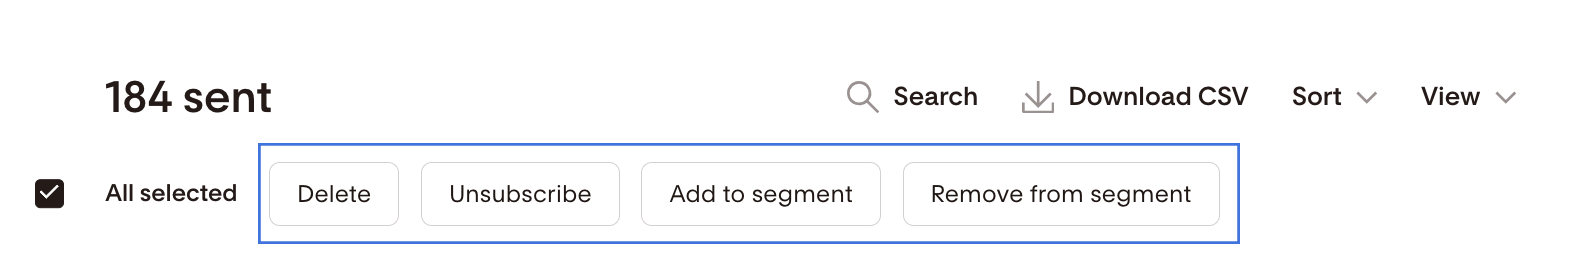
You can bulk select subscribers from this report and apply the following actions:
Delete: Permanently removes the subscriber record from your entire list. This can't be undone.
Unsubscribe: Removes the subscriber from your entire list and all segments. They won't be re-subscribed unless they opt in again. This can't be undone.
Add to segment: Adds the selected subscribers to one or more segments.
Remove from segment: Removes the selected subscribers from one or more segments.
To select subscribers in bulk, hover above the Email column until the Select all checkbox appears. You can also use the View selector to make a targeted selection first.
Email engagement charts
Scroll down to see your Open rate and Click rate as percentages. Click the + icon in the bottom right corner to explore a deeper breakdown.
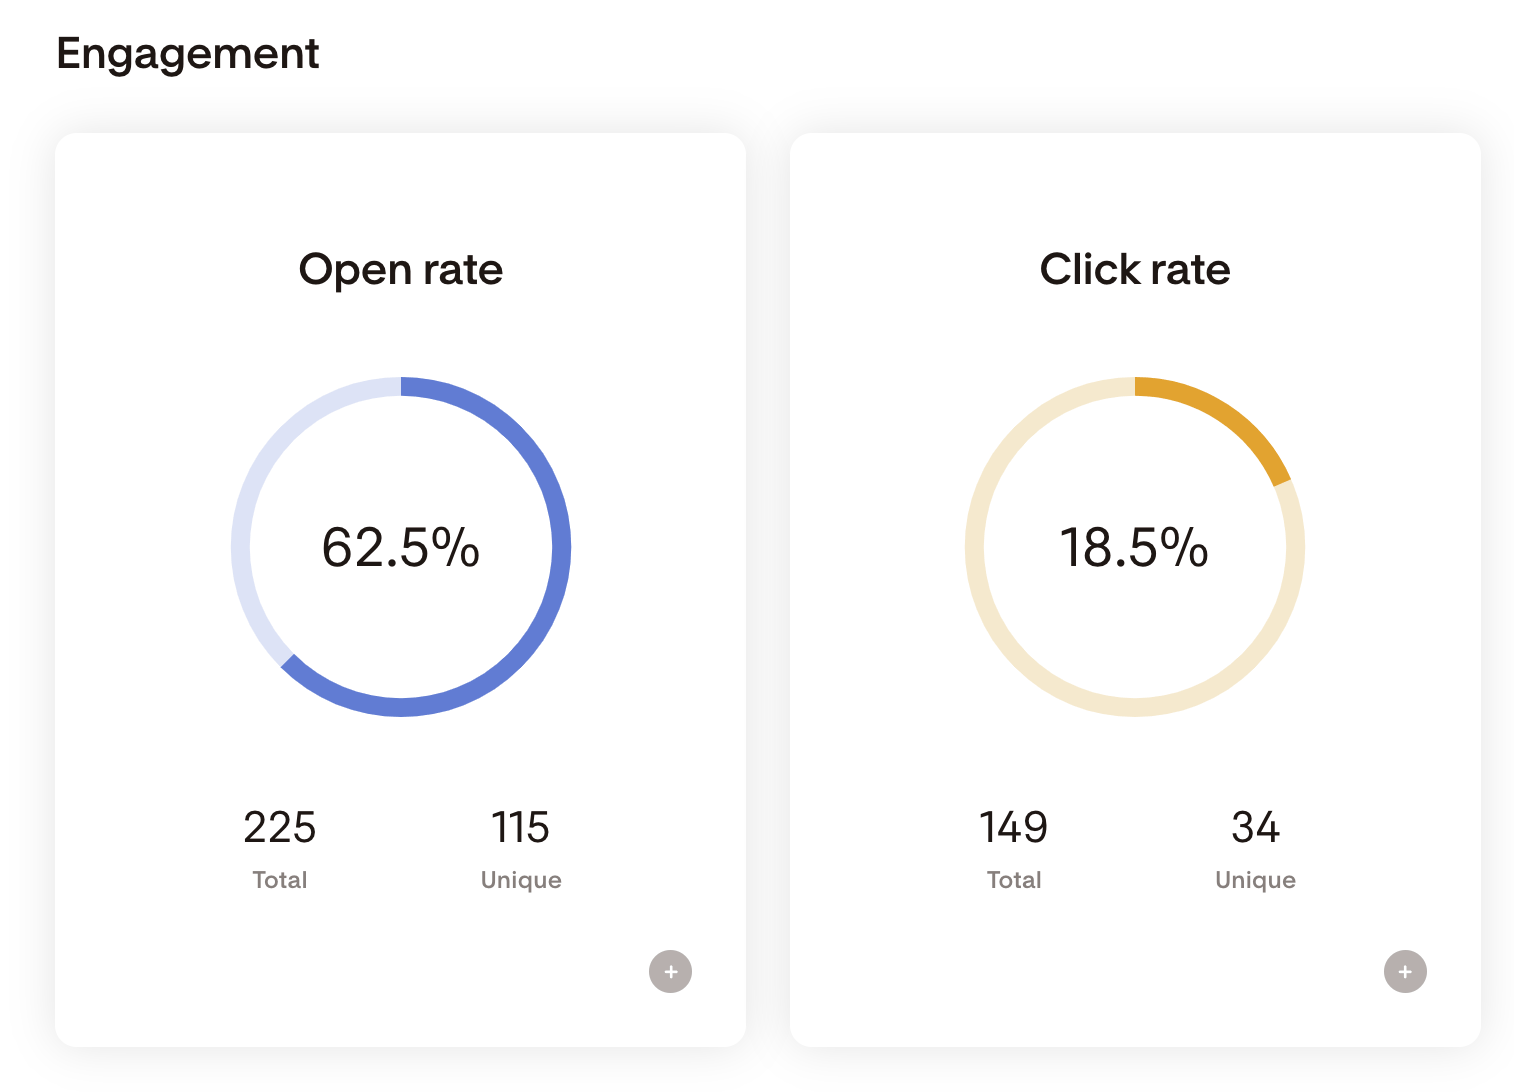
Open rates and click rates will vary from email to email. To see how yours compare and get tips on improving them, read What is considered a good open rate and click rate?
If you notice a sudden drop in open rates, follow the steps in My email open rates dropped. What should I do?
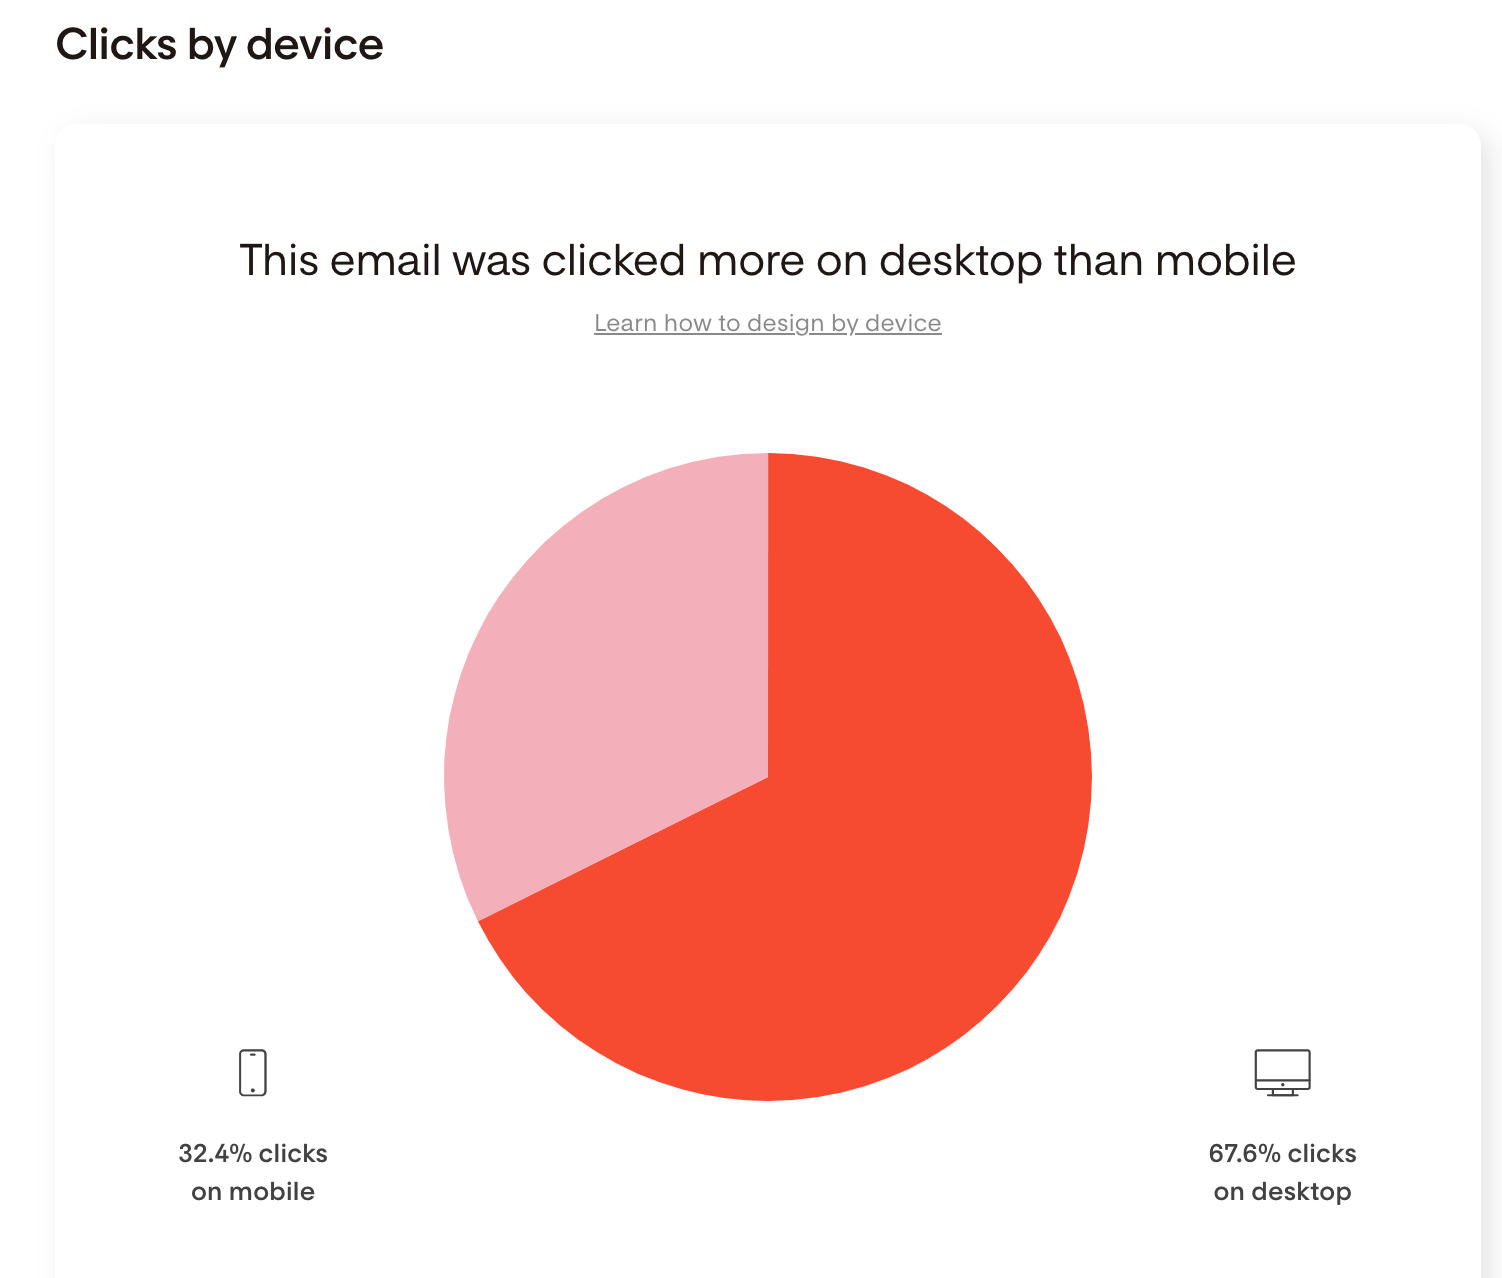
Clicks by device
This section shows whether subscribers clicked your links on a desktop or mobile device. That info can help you design emails that look great and perform well on the devices your audience actually uses.
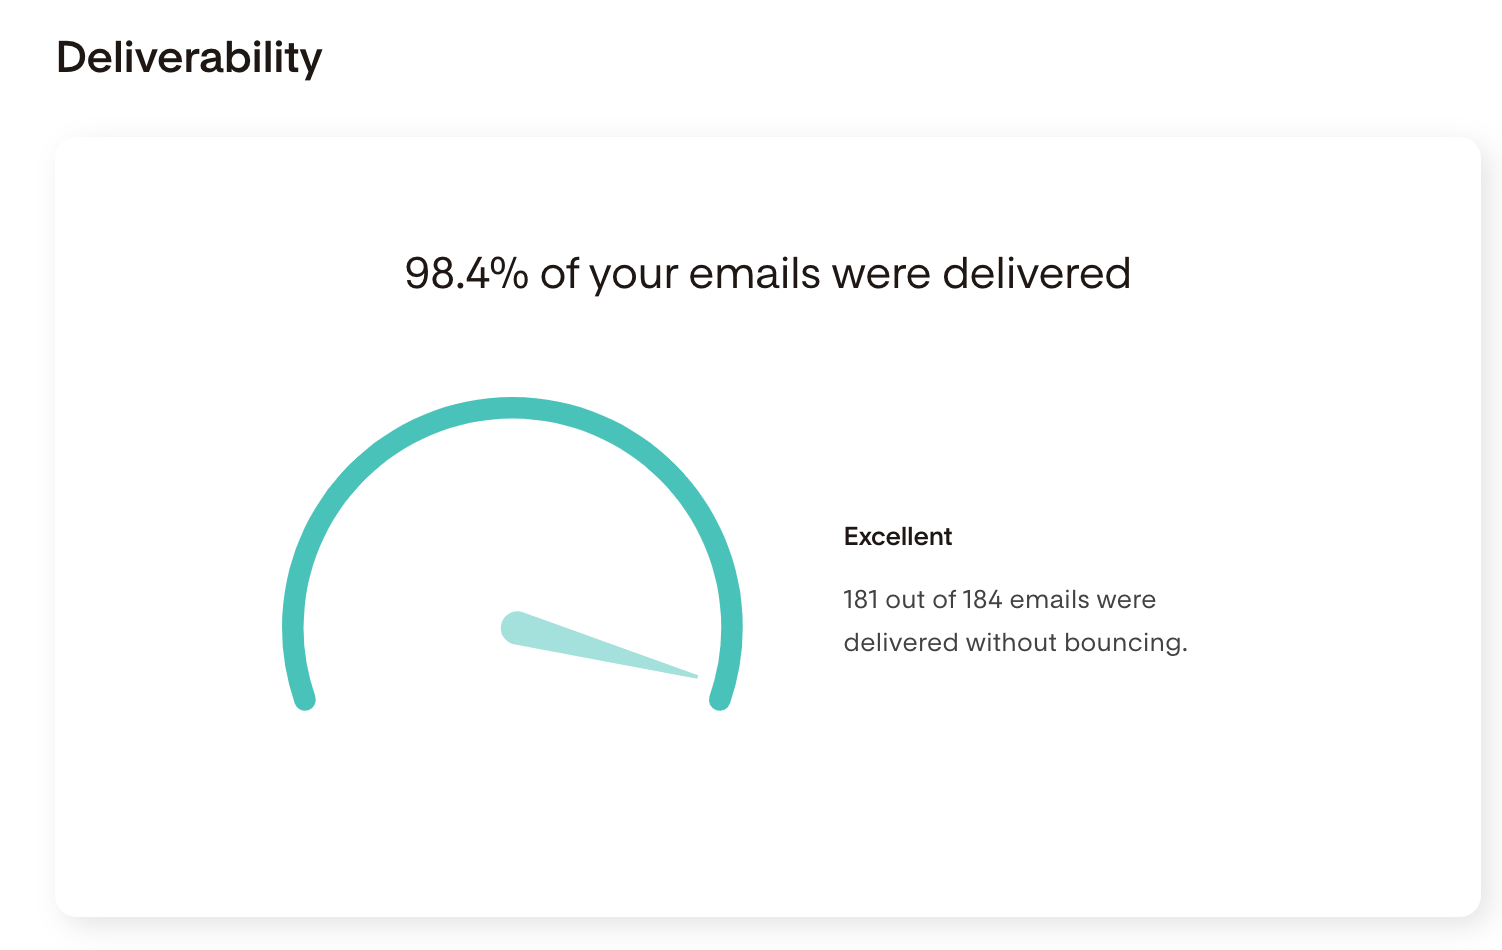
Delivery rate
Your delivery rate shows how many of your emails actually made it to subscriber inboxes without bouncing back.
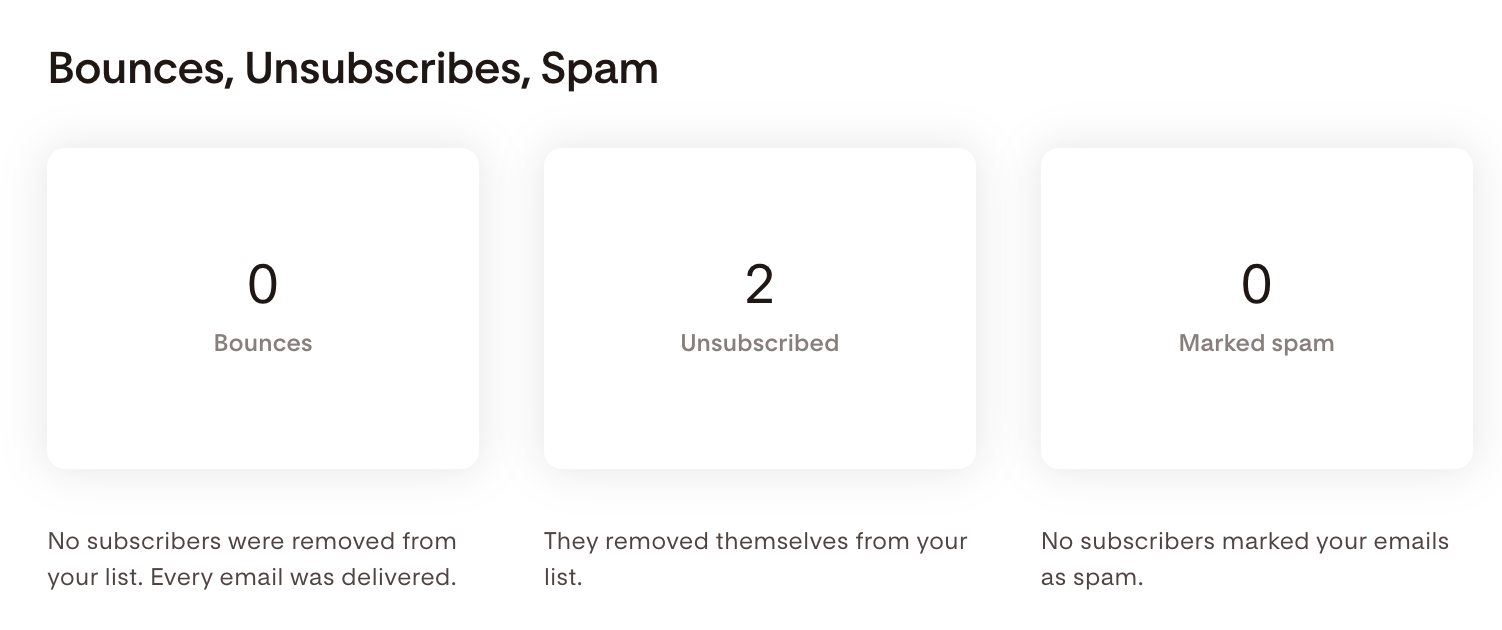
Bounces, Unsubscribes, Spam
The final section of your analytics report shows metrics related to current email send:
Bounces: Email addresses that couldn't receive your email
Unsubscribes: Subscribers who opted out after this send
Spam: Subscribers who marked your email as spam
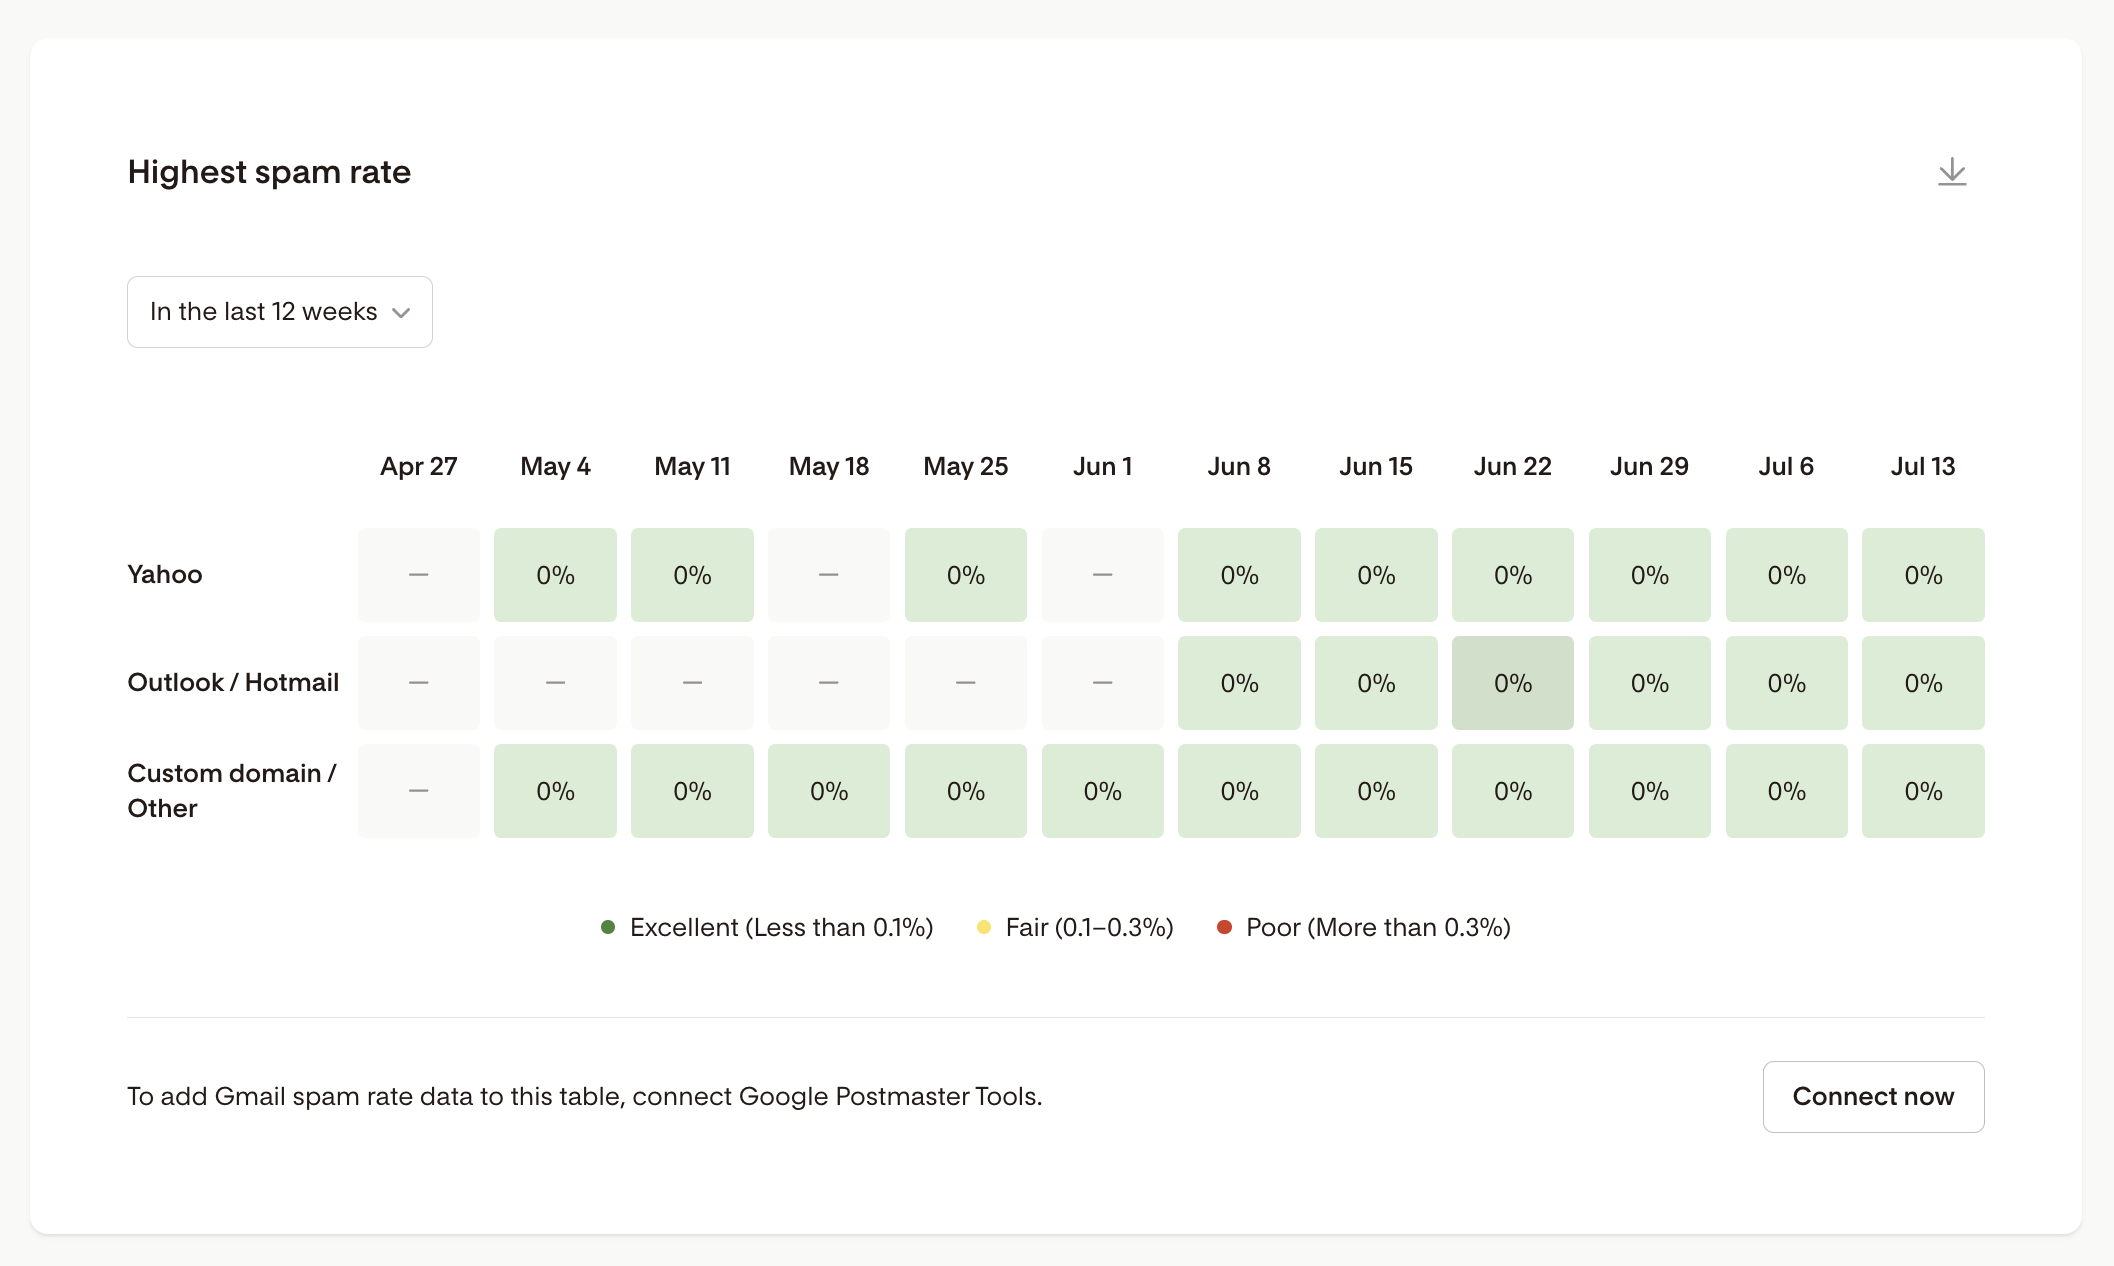
A note on marked as spam reporting:
You can see how you're doing with marked-as-spam complaints overall in the spam rate table on your account-level Emails Analytics dashboard. If you connect your Google Postmaster Tools account to Flodesk, Gmail's own data will surface there too, since Gmail doesn't report spam complaints back to Flodesk directly.
FAQ
How do I view my email analytics?
Go to your Emails dashboard, hover over a sent email, and click View Results. Your full analytics report will load from there.
What's the difference between "sent" and "delivered"? "
Sent" is the total number of subscribers your email was sent to. "Delivered" is how many of those emails successfully reached a subscriber's inbox. The difference usually accounts for bounces.
Why is my open rate lower than I expected?
Open rates can vary depending on your subject line, send time, list health, and audience engagement. For benchmarks and tips, check out our article on what is considered a good open rate and click rate.
Can I see which subscribers didn't open my email?
Yes. Use the View selector in your analytics report to filter for subscribers who didn't open the email. From there, you can also take bulk actions on that group, like adding them to a segment.
Why might my spam count be underreported?
Gmail and some other inbox providers don't always send spam notifications to email marketing platforms like Flodesk. To track Gmail spam rates more accurately, set up Google Postmaster Tools.
Can I download my email analytics?
Yes. From your analytics report, you can download a CSV file of the full send data.
What bulk actions can I take from the analytics report?
You can delete subscribers, unsubscribe them from your list, add them to a segment, or remove them from a segment. Note that deleting and unsubscribing are permanent and can't be undone.
What does the click-by-device data tell me?
It shows whether subscribers clicked links on desktop or mobile. This can help you make design decisions, like ensuring buttons are easy to tap on a small screen.