What is the best day and time to send my emails?
Sending the right content to the right recipients at the right time is key to your email marketing success. But how can you find out which day—and time of day—seems to be the best for your audience?
Best days to send your emails
Step 1. Login to Flodesk, then click on Analytics > Emails.
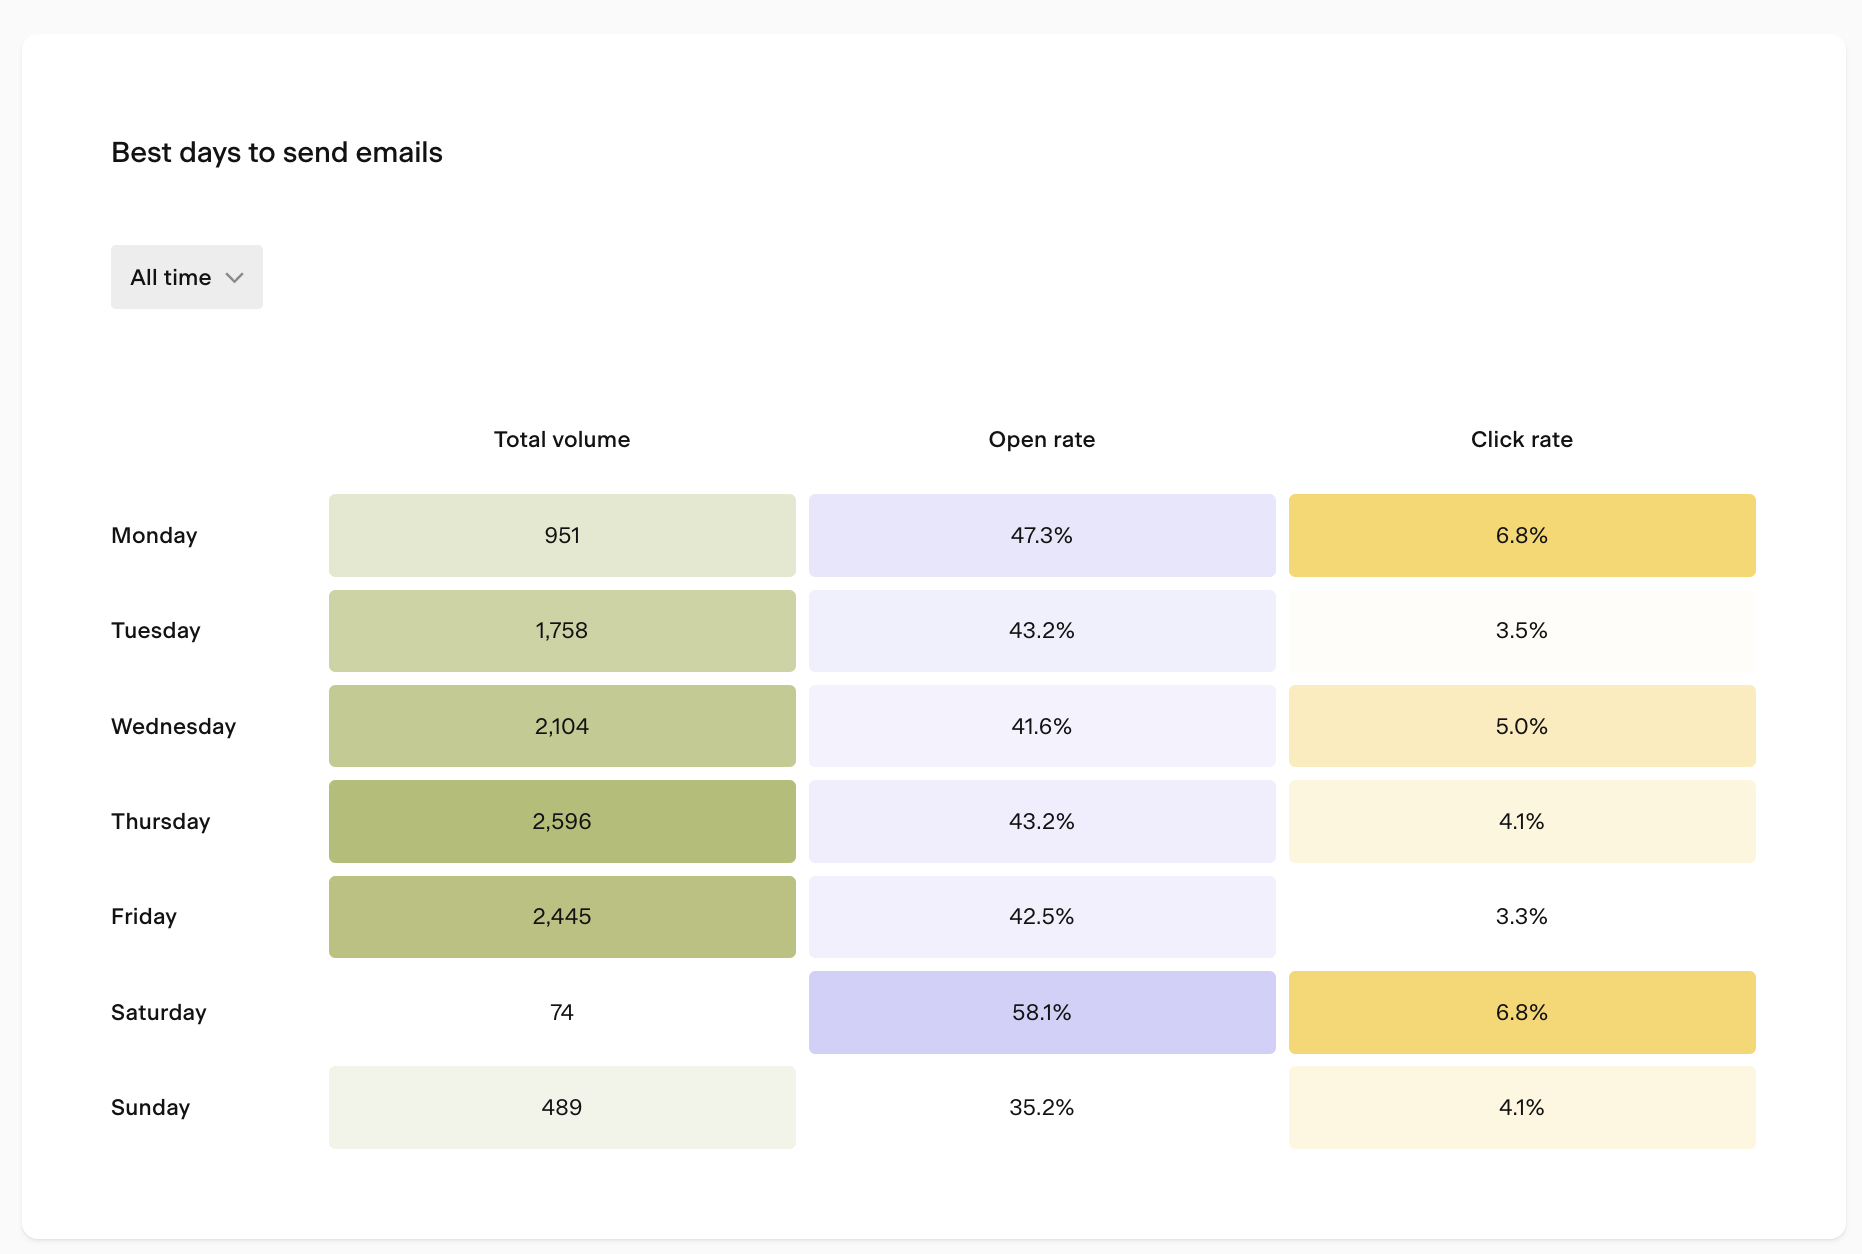
Step 2. Scroll down on the emails analytics page, and locate the Best days to send emails heat map chart.
Step 3. Click on the time period selector and select “All time”.
Step 4. Look at the highest open and click rates concerning the email volume.
For example, although on this sample screenshot Saturday has the highest Open rate and Click rate, only 74 emails were sent on a Saturday—which is a low volume to draw conclusions.
Remaining at this example:
If you’re after the opens, then Thursday is your best bet.
If you want them to click your CTAs, consider sending the email on Monday or Wednesday.
Now that you know the best days to focus on let’s check the best time of day for your email send.
When subscribers open your emails
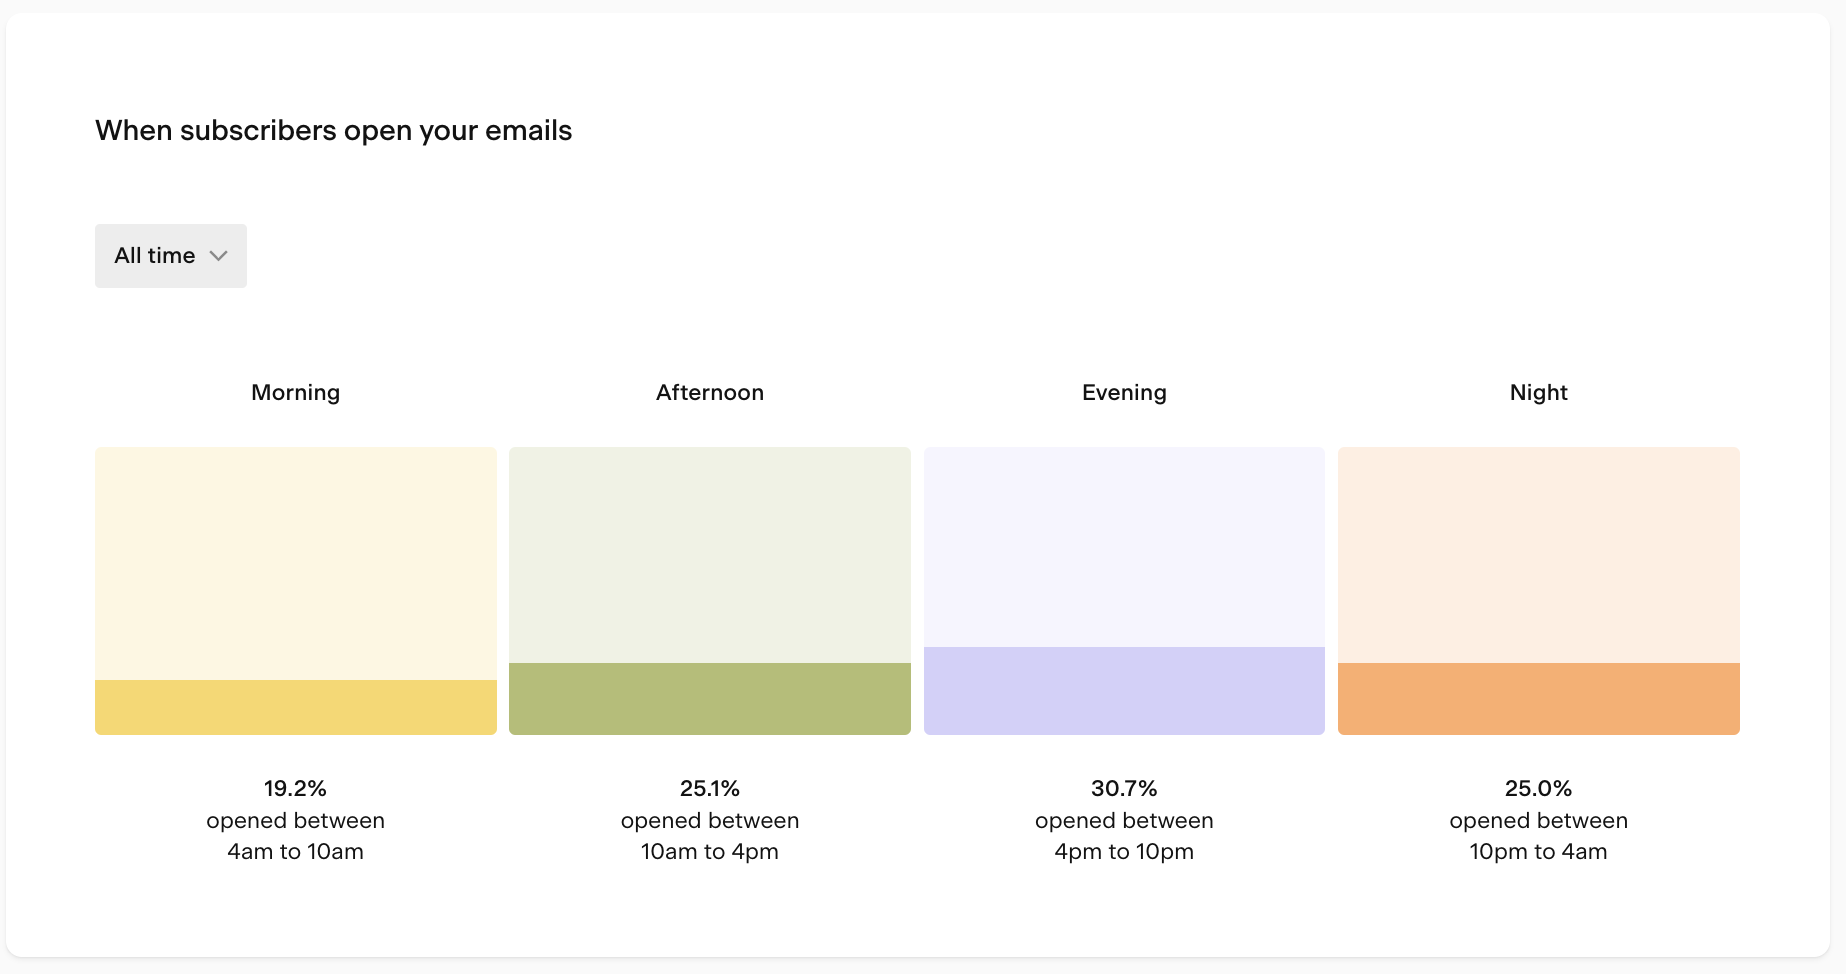
Step 1. Still, on the emails analytics page, scroll a bit down to see the When subscribers open your emails heat map chart.
Step 2. Click on the time period selector and select “All time”.
Step 3. Look at the highest open rates.
In our example, you would achieve the best results when sending the email in the afternoon/evening.
Pro tip:
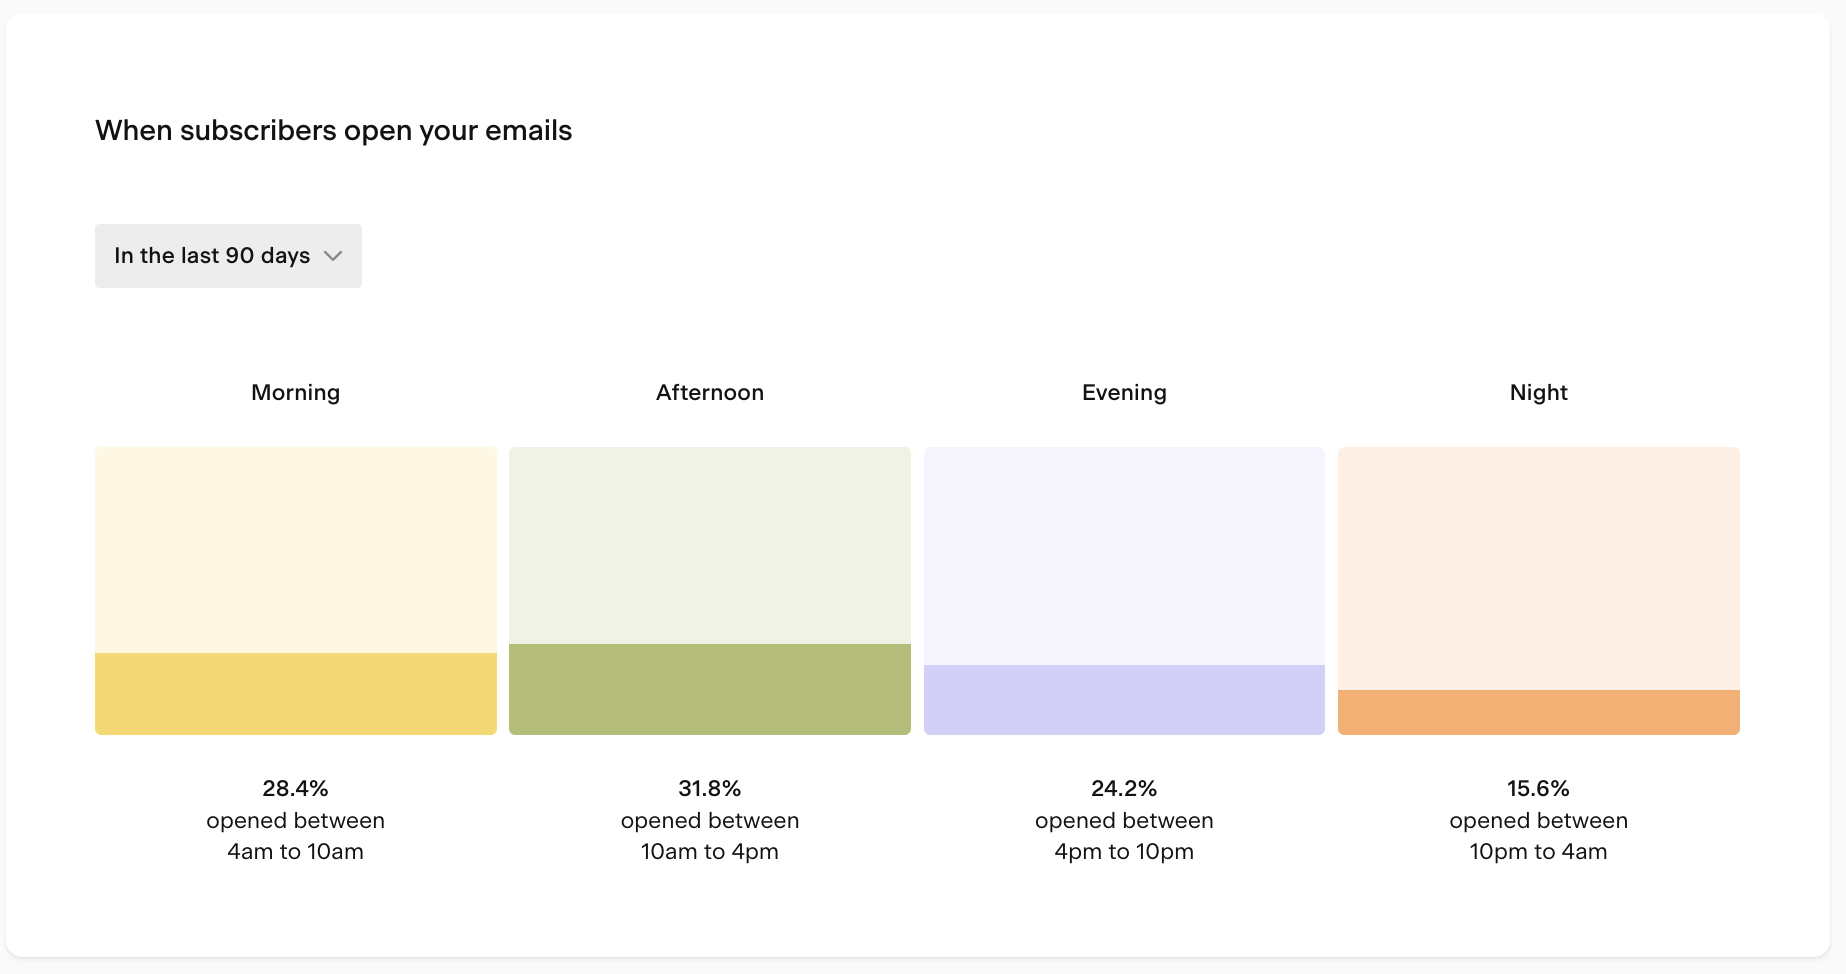
If you're sending weekly emails, it's also worth checking the results for the last 90 days to see if there's been any significant shift in how subscribers have interacted with your emails recently.
This data set in our example shows that subscribers would instead open the emails in the morning/afternoon.
And that’s it. Go on and design your next big campaign. We’re cheering you on.
And remember, you can create sales pages for your online offers easily with Flodesk Checkout.
Summary
Finding the right day and time for your email sends is as easy as this:
Click on Analytics > Emails.
Check the When subscribers open your emails and the When subscribers open your emails heat map charts.


