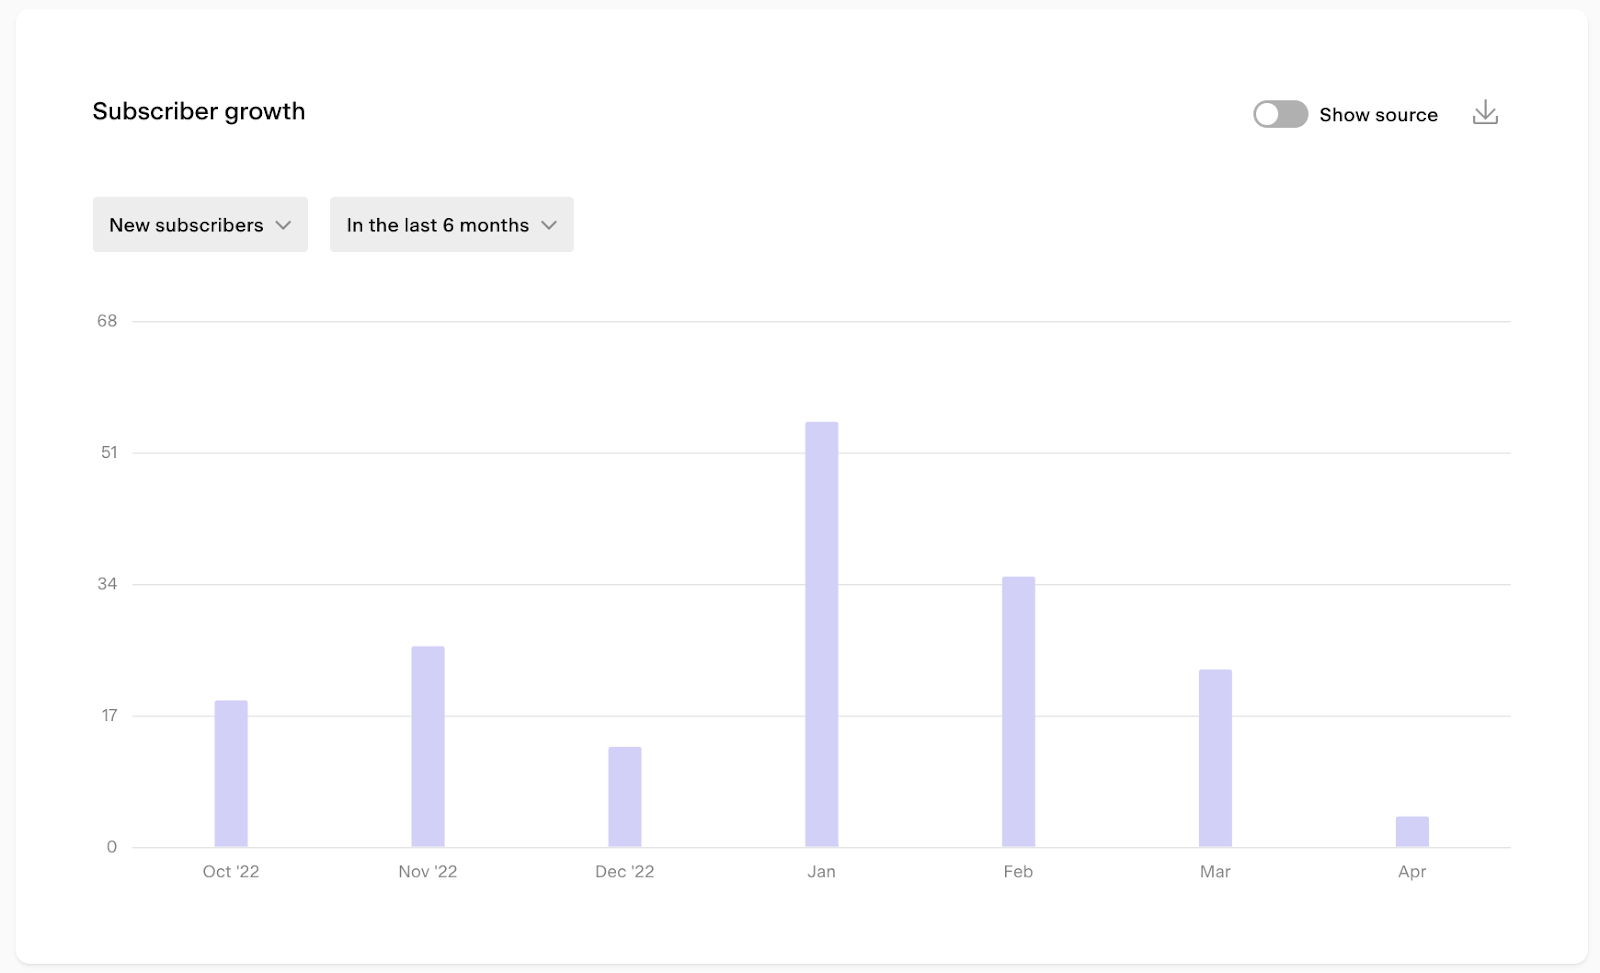
How many new subscribers did join my list in the last 6 months?
Have you been focusing on email list growth strategies in the last couple of months?
Do you want to know how fruitful your efforts were and how many new subscribers have joined your list?
Step 1. Login to Flodesk, then click on Analytics > Subscribers.
Step 2. Scroll down on the subscribers analytics page, and locate the Subscriber growth bar chart.
Step 3. Set it to show “New subscribers” and pick the relevant time period.
In our example, we selected “in the last 6 months”.
Hover over each of the bars to see how many people joined that month.
Click on the bars to see your new subscribers listed by their email addresses. You can even export them into a CSV—and upload them to a new segment!
If you turn on the “Show source” toggle, it will also break down how new subscribers joined your list, including:
CSV upload
Manual entry
Form opt-in
Checkout customer
Integration
Note: subscribers added to your list via Zapier connection are categorized under “Manual entry”. And subscribers who've been added to your list via an integration (currently only Shopify, more to come!) will have the source “Integration”.
Summary
To see how your list grows over time, click on Analytics > Subscribers and check the Subscriber growth bar chart.

