
How to track checkout visitors over time in Flodesk
Overview
The Checkout activity chart in Flodesk shows you how many people visited your checkout pages over any time period you choose. Whether you've just launched a new offer or want to track traffic from a recent campaign, this chart gives you a clear picture of what's happening and when.
How to view checkout visitor data
Log in to Flodesk and go to Analytics > Checkouts
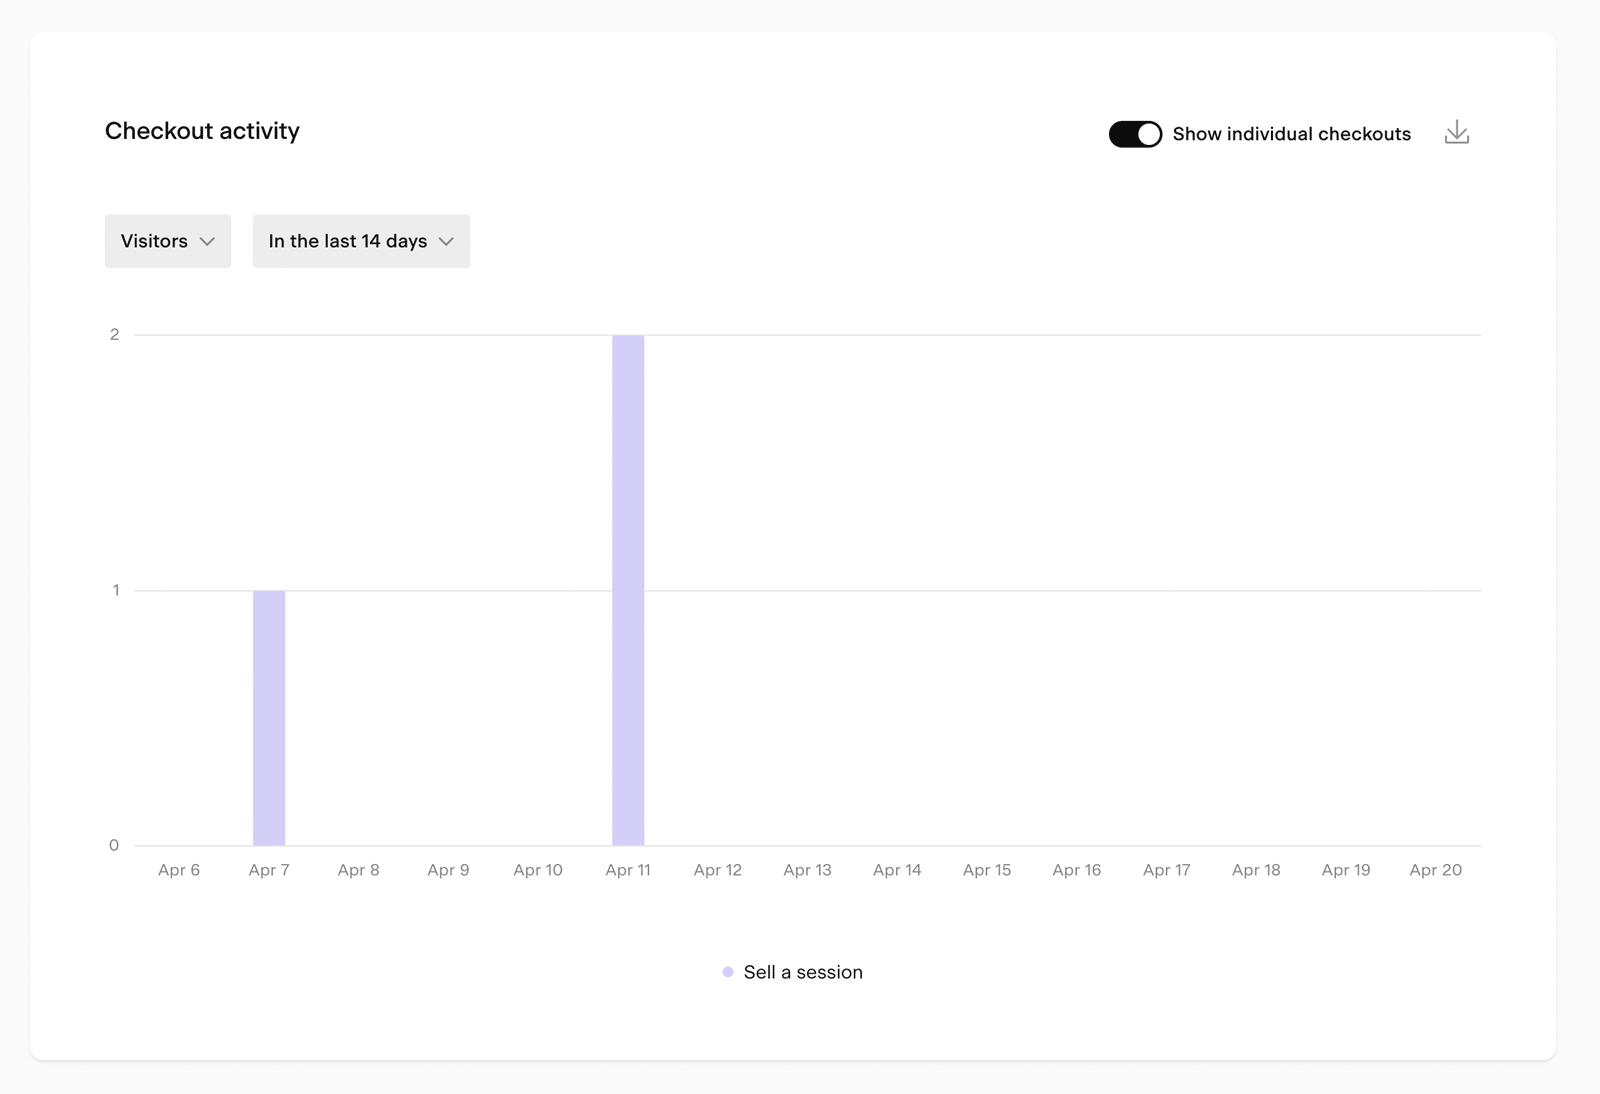
Scroll down to the Checkout activity bar chart
Set the metric dropdown to Visitors
Use the time selector to choose your preferred view
You can customize the time period using these options:
Time unit | Available ranges |
|---|---|
Daily | 7 days, 14 days, 30 days, custom |
Weekly | 8 weeks, 12 weeks, 24 weeks, custom |
Monthly | 6 months, 12 months, 24 months, custom |
Yearly | All years |
For example, to see the last two weeks day by day, set the time unit to Days and select 14 days.
You can also switch the metric dropdown from Visitors to Orders or Total sales to see other checkout activity over the same time period.
How to use the data
Use the visitor chart to understand how your marketing efforts are translating into checkout traffic:
If you ran a campaign or promotion, look for a spike in visitors during that period to gauge how effective it was
If visitor numbers are lower than expected, consider additional ways to share your offer, such as adding it to your email footer, posting on social media, or linking to it from your website
Comparing different time periods can help you spot patterns, like whether certain days or weeks consistently drive more traffic
FAQ
How do I see how many people visited my checkout pages in Flodesk?
Go to Analytics > Checkouts and find the Checkout activity bar chart. Set the metric dropdown to Visitors, then use the time selector to choose the time unit and range you want to view.
Can I see checkout visitor data for a custom time period?
Yes. In the time selector, choose your preferred time unit (daily, weekly, monthly, or yearly) and select Custom to set a specific date range.
What time periods can I view checkout visitor data for?
You can view data by day (7, 14, or 30 days), by week (8, 12, or 24 weeks), by month (6, 12, or 24 months), or by year (all years). A custom date range is also available for each time unit (except for years).
Can I see data for individual checkouts separately?
Yes. Look for a toggle to show individual checkouts in the chart. This lets you see how each checkout is performing rather than viewing all checkouts combined.
What other metrics can I view in the Checkout activity chart besides visitors?
You can switch the metric dropdown to view Orders (the number of completed purchases) or Total sales over the same time period.
What should I do if my checkout visitor numbers are lower than expected?
Consider how and where you're sharing the checkout link. Adding it to your email footer, featuring it in a dedicated campaign, sharing it on social media, or linking to it from your website are all ways to increase visibility. You can also look at the time period around any promotions you've run to see whether those efforts drove a noticeable uptick in traffic.