
How to find the best day and time to send your emails in Flodesk
Overview
Sending at the right time can make a real difference to your open and click rates. Flodesk's email analytics include two heat map charts that show you which days and times your subscribers are most likely to open and engage with your emails, based on your own audience's behavior.
How to find the best days to send your emails
Log in to Flodesk and go to Analytics > Emails
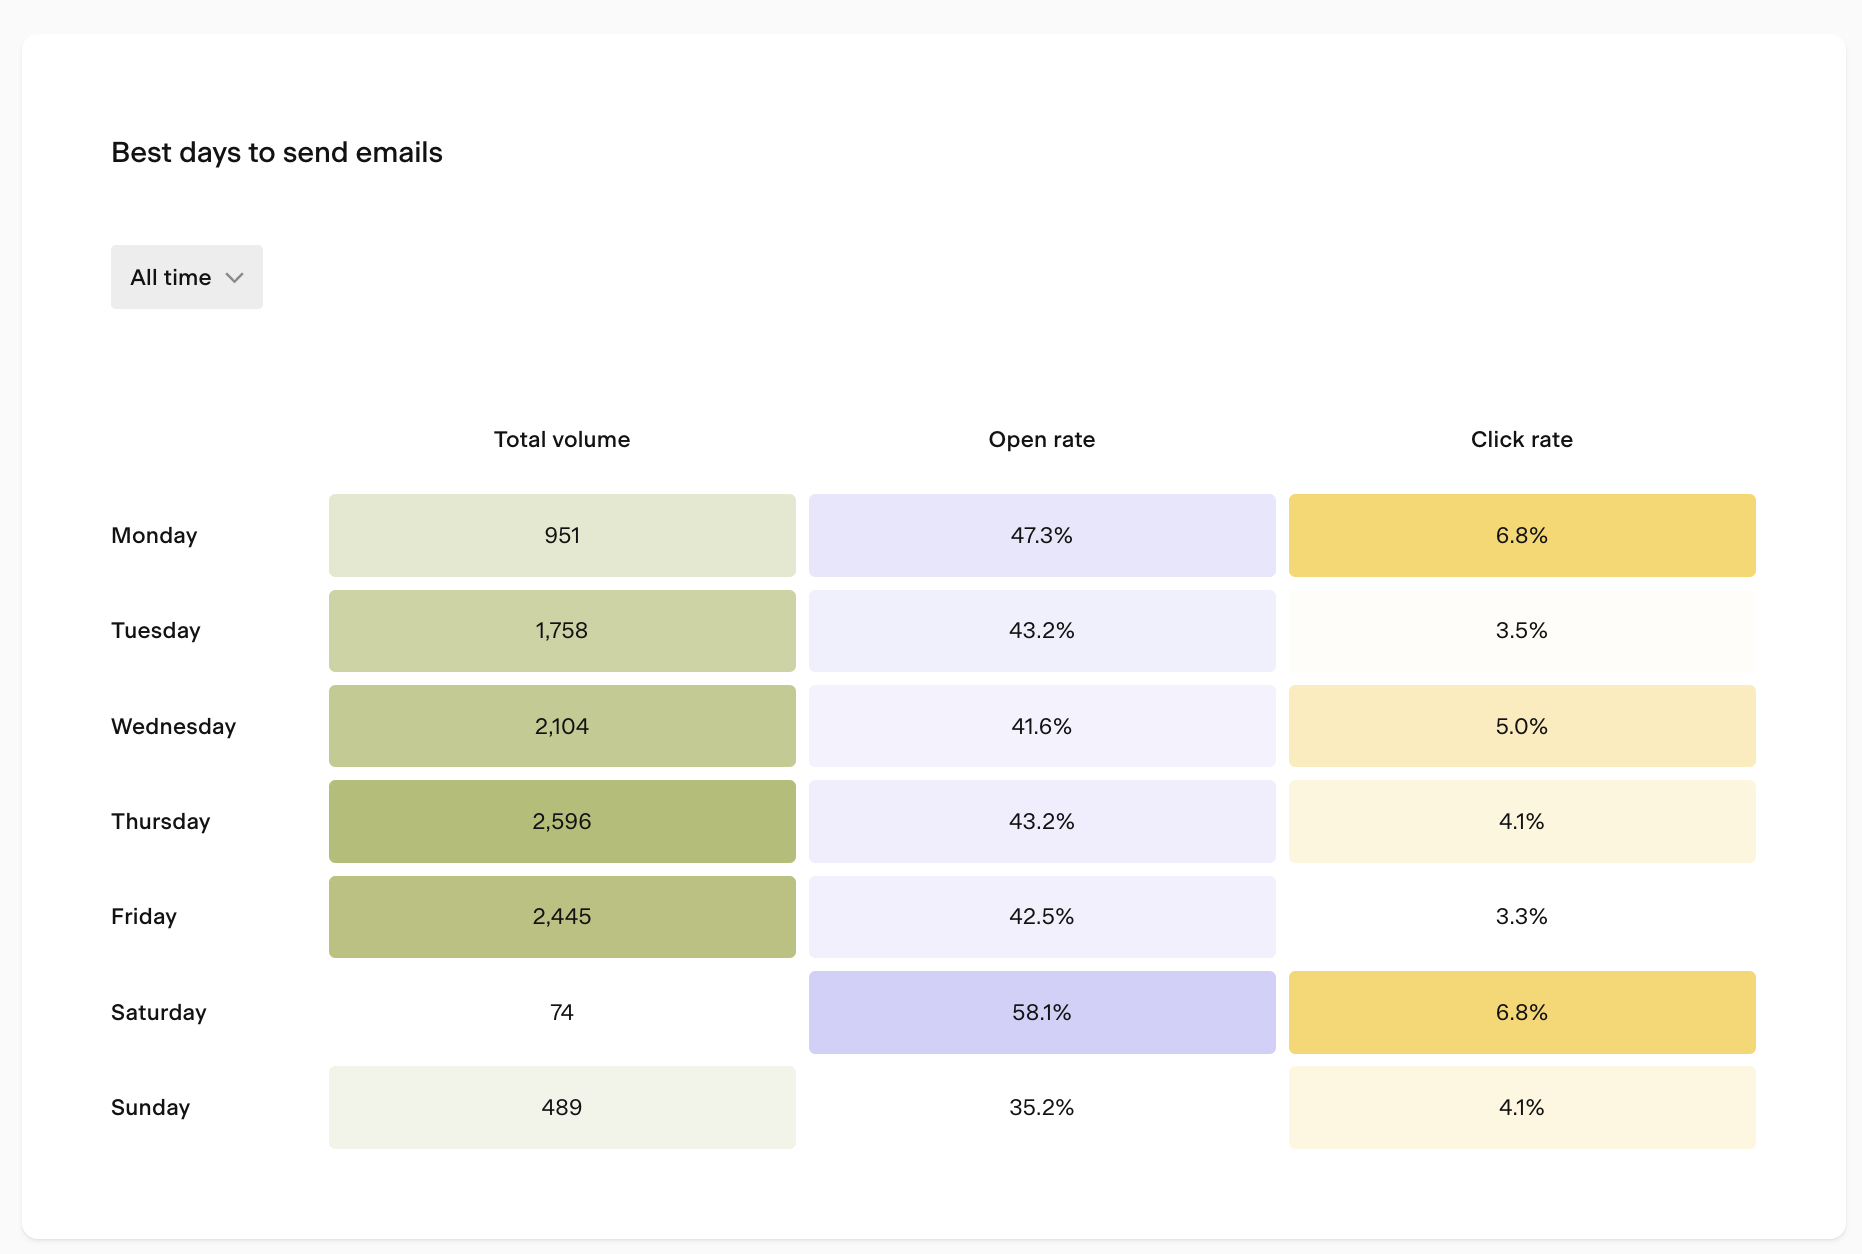
Scroll down to the Best days to send emails heat map chart
Set the time period selector to All time
Look for the days with the highest open rates and click rates
One important thing to keep in mind: volume matters. A day with a very high open rate but only a small number of emails sent isn't a reliable data point. Focus on days where both the rate and the volume are strong.
Looking at the below screenshot example, if Saturday shows the highest open rate but only 74 emails were sent on a Saturday, that's too small a sample to draw conclusions from. A day like Thursday, with a strong open rate and much higher send volume, is a more dependable guide.
If you want to maximize opens, look for the day with the highest open rate at a strong send volume
If you want more clicks on your calls to action, look at click rate by day instead
How to find the best time of day to send your emails
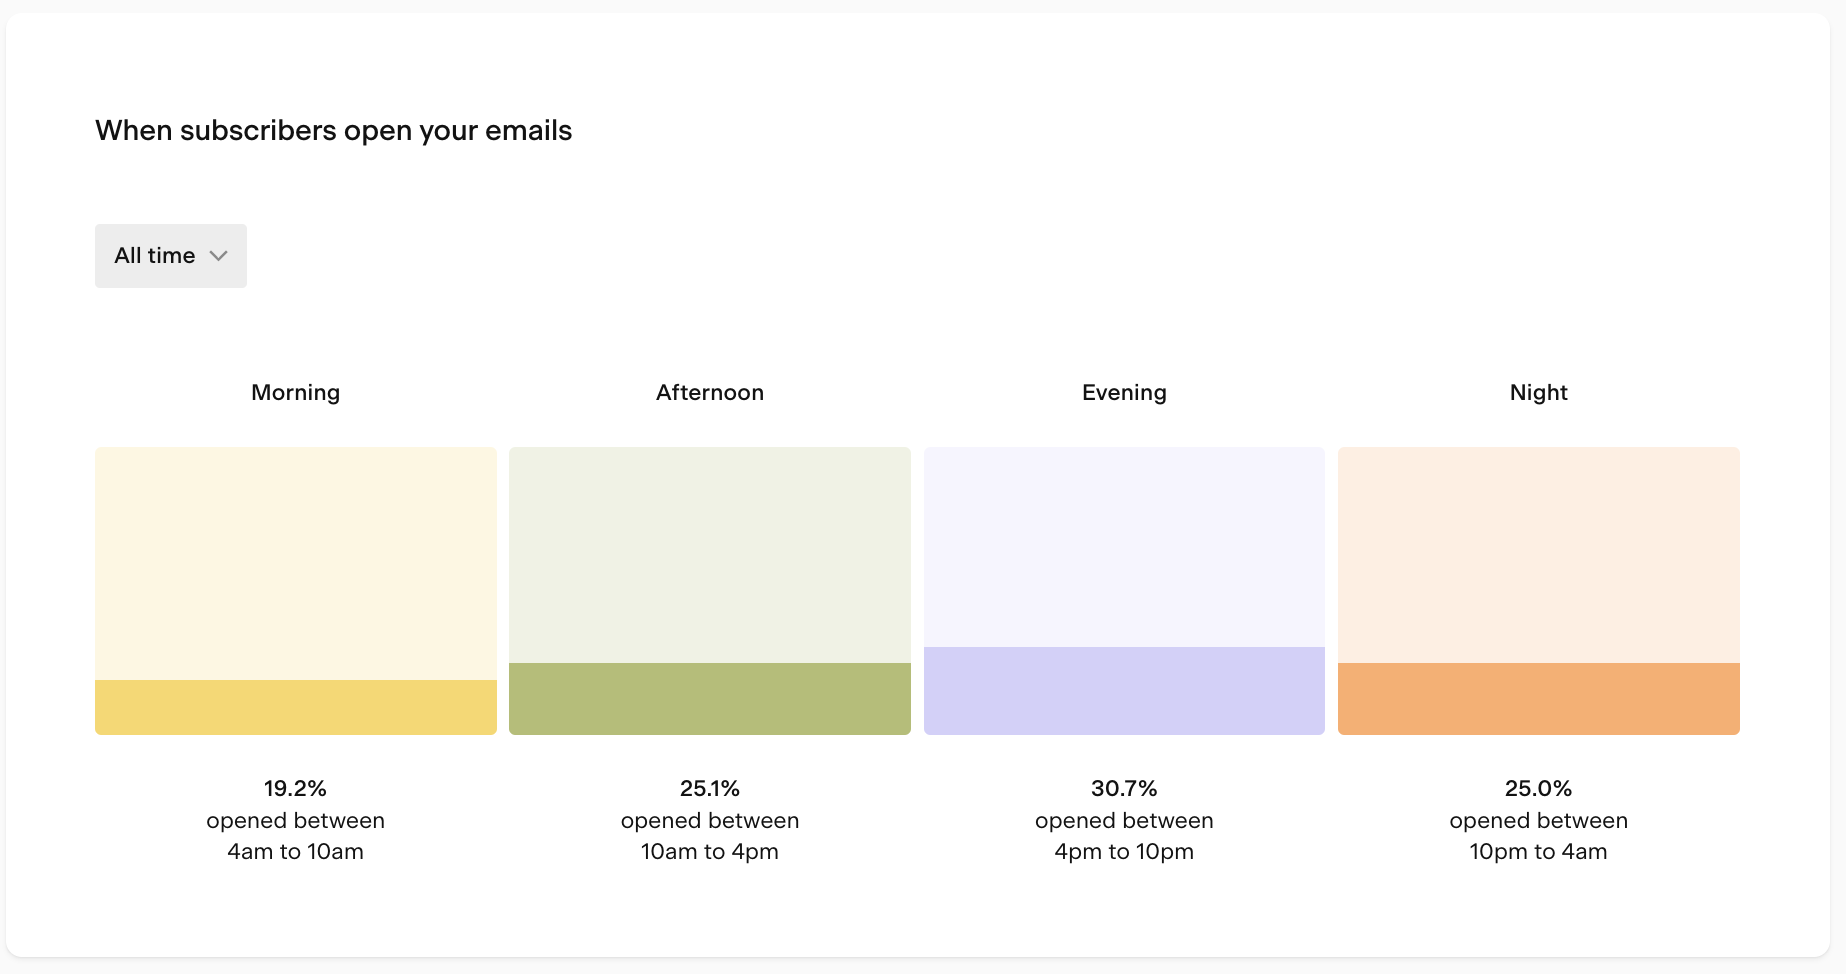
On the same Analytics > Emails page, scroll down to the When subscribers open your emails heat map chart
Set the time period selector to All time
Look for the time blocks with the highest open rates
The chart shows you when during the day your subscribers are most likely to open your emails, so you can schedule sends to land in their inbox at the right moment.
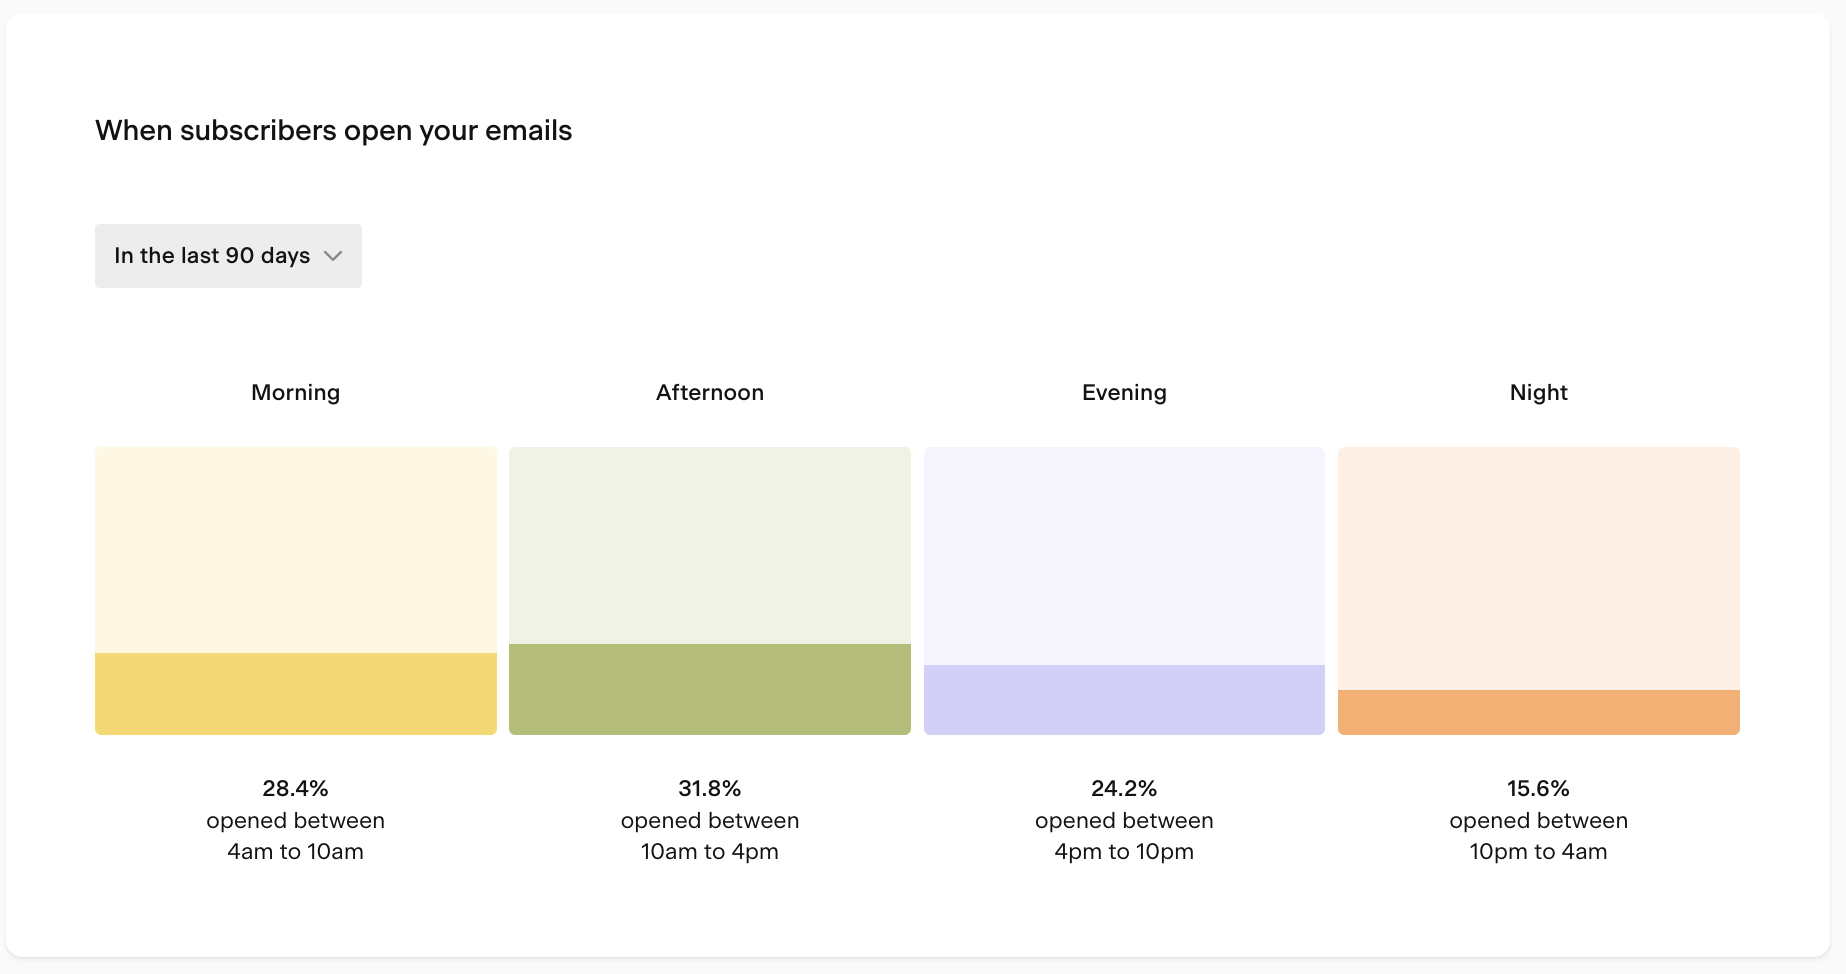
Pro tip: if you send emails regularly (weekly, for example), it's also worth checking the last 90 days in addition to all time. Recent behavior can differ from historical patterns. For example, your all-time data might show afternoon as the peak time, while the last 90 days might show a shift toward morning opens. When there's a meaningful difference, the more recent data is usually the better guide for your next send.
FAQ
How do I find the best day to send my emails in Flodesk?
Go to Analytics > Emails and scroll down to the Best days to send emails heat map chart. Set the time period to All time and look for the days with the strongest combination of open rate (or click rate) and send volume. Days with high rates but very few emails sent aren't reliable guides.
How do I find the best time of day to send my emails in Flodesk?
On the Analytics > Emails page, scroll down to the When subscribers open your emails heat map chart. Set the time period to All time and look for the time blocks with the highest open rates. This shows you when your subscribers are most likely to open your emails.
Why does send volume matter when reading the heat map?
A high open rate based on a small number of sends can be misleading. For example, if only 10 emails were sent on a particular day and 8 were opened, that's an 80% open rate, but it's not a reliable indicator of what will happen at scale. Look for days and times where both the rate and the volume are strong.
Should I use "All time" or a more recent time period when reading the charts?
Both are useful. All time gives you the broadest picture, but checking the last 90 days is also worth doing, especially if you send regularly. Subscriber behavior can shift over time, and recent data may reveal patterns that differ from your historical trends. When there's a meaningful difference, the more recent data is usually the better guide.
Do these charts show data for my specific audience or general benchmarks?
These charts are based entirely on your own subscribers' behavior, not industry averages. That makes them a much more accurate guide for your specific audience than any general best-practice advice.
What's the difference between the two heat map charts?
The Best days to send emails chart shows performance broken down by day of the week, so you can compare open and click rates across Monday through Sunday. The When subscribers open your emails chart shows performance broken down by time of day, so you can see which hours tend to get the most engagement.