
How to track subscriber growth over time in Flodesk
Overview
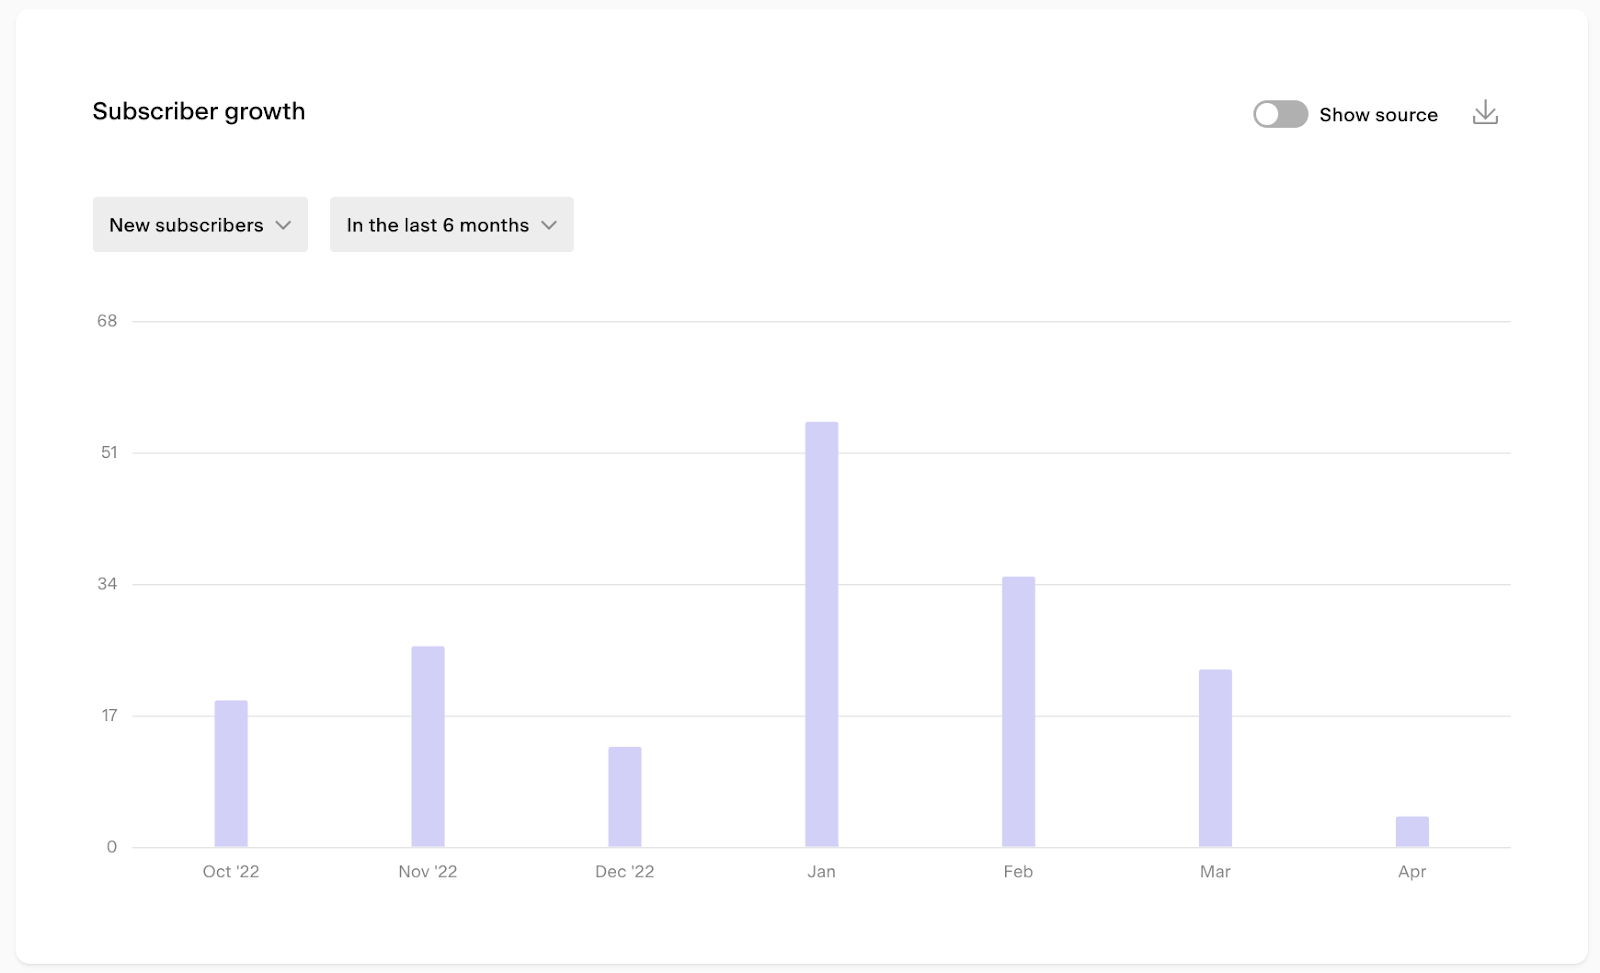
The Subscriber growth chart in Flodesk shows you how many new subscribers joined your list over any time period you choose. Whether you want to review the last two weeks or the last two years, you can see how your list is growing and where those subscribers are coming from.
How to view your subscriber growth
Log in to Flodesk and go to Analytics > Subscribers
Scroll down to the Subscriber growth bar chart
Set the metric dropdown to New subscribers
Use the time selector to choose your preferred view
You can view data across a range of time periods:
Time unit | Available ranges |
|---|---|
Daily | 7 days, 14 days, 30 days, custom |
Weekly | 8 weeks, 12 weeks, 24 weeks, custom |
Monthly | 6 months, 12 months, 24 months, custom |
Yearly | All years |
For example, to see growth over the last six months, set the time unit to Monthly and select 6 months.
How to dig deeper into the data
See the exact count for any period Hover over any bar in the chart to see the exact number of new subscribers who joined during that time unit.
See who joined Click on any bar to open a list of the subscribers who joined during that period, shown by email address. You can also export this list as a CSV and upload it to a new segment in Flodesk.
See where subscribers came from Toggle on Show source to break down new subscribers by how they joined your list. Sources include:
Source | What it means |
|---|---|
Form opt-in | Joined through a Flodesk opt-in form |
Checkout customer | Added as a buyer through Flodesk Checkout |
CSV upload | Imported via a CSV file |
Manual entry | Added manually, including subscribers added via Zapier |
Integration | Added through a direct integration |
FAQ
How do I see how many new subscribers joined my list in Flodesk?
Go to Analytics > Subscribers and scroll down to the Subscriber growth bar chart. Set the metric to New subscribers, then use the time selector to choose the time period you want to review.
Can I view subscriber growth for a custom time period?
Yes. In the time selector, choose your preferred time unit (daily, weekly, monthly, or All years) and select Custom to set a specific date range.
What time periods can I view subscriber growth for?
You can view data by day (7, 14, or 30 days), by week (8, 12, or 24 weeks), by month (6, 12, or 24 months), or by year (all years). A custom date range is also available for each time unit (except for all years).
Can I see which specific subscribers joined during a time period?
Yes. Click on any bar in the chart to see a list of the subscribers who joined during that period, shown by email address. You can also export this list as a CSV.
Can I add subscribers from the chart directly to a Flodesk segment?
Yes. Click on a bar to open the subscriber list for that period, export it as a CSV, and then upload that CSV to a new or existing segment in Flodesk.
How do I see where my new subscribers came from?
Toggle on Show source in the Subscriber growth chart. This breaks down new subscribers by how they joined, including form opt-ins, Checkout purchases, CSV uploads, manual entry, and integrations.
Why are my Zapier-added subscribers showing as "Manual entry"?
Subscribers added via a Zapier connection are categorized under Manual entry in the source breakdown. This is expected behavior, not an error.
What does the "Integration" source mean in the subscriber growth chart?
Integration covers subscribers added through a direct Flodesk integration.