
How to View Your Workflow Performance
Easily track how your automation emails are performing—step-by-step.
Flodesk Workflows are a powerful way to automate your email strategy, whether you’re nurturing leads, onboarding new subscribers, or re-engaging inactive contacts. But how do you know if your workflow is working?
That’s where workflow analytics come in.
Flodesk gives you detailed stats for each email in your workflow and an overview of how your entire automation is performing. Here’s how to access and use those insights.
Where to Find Your Workflow Analytics
To open the analytics report for a specific workflow:
Go to your Workflows dashboard
Find the published workflow you want to review
Click the bar graph icon in the lower-right corner of the workflow card
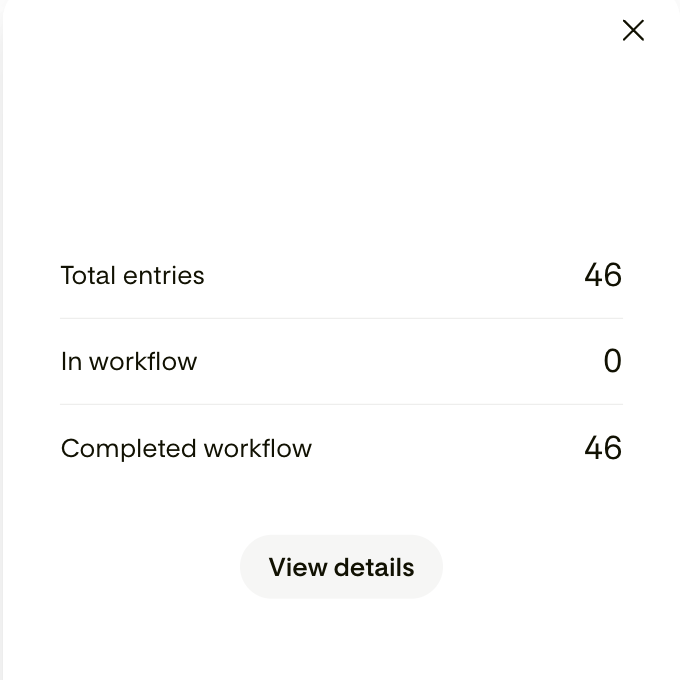
Click View details
This opens a two-tab analytics view: Overview and Details
Overview Tab
This is your Workflow’s performance at a glance.
Summary snapshot
Quickly see:
Total subscribers who entered this workflow
Name of the workflow
How many subscribers are still active in the workflow
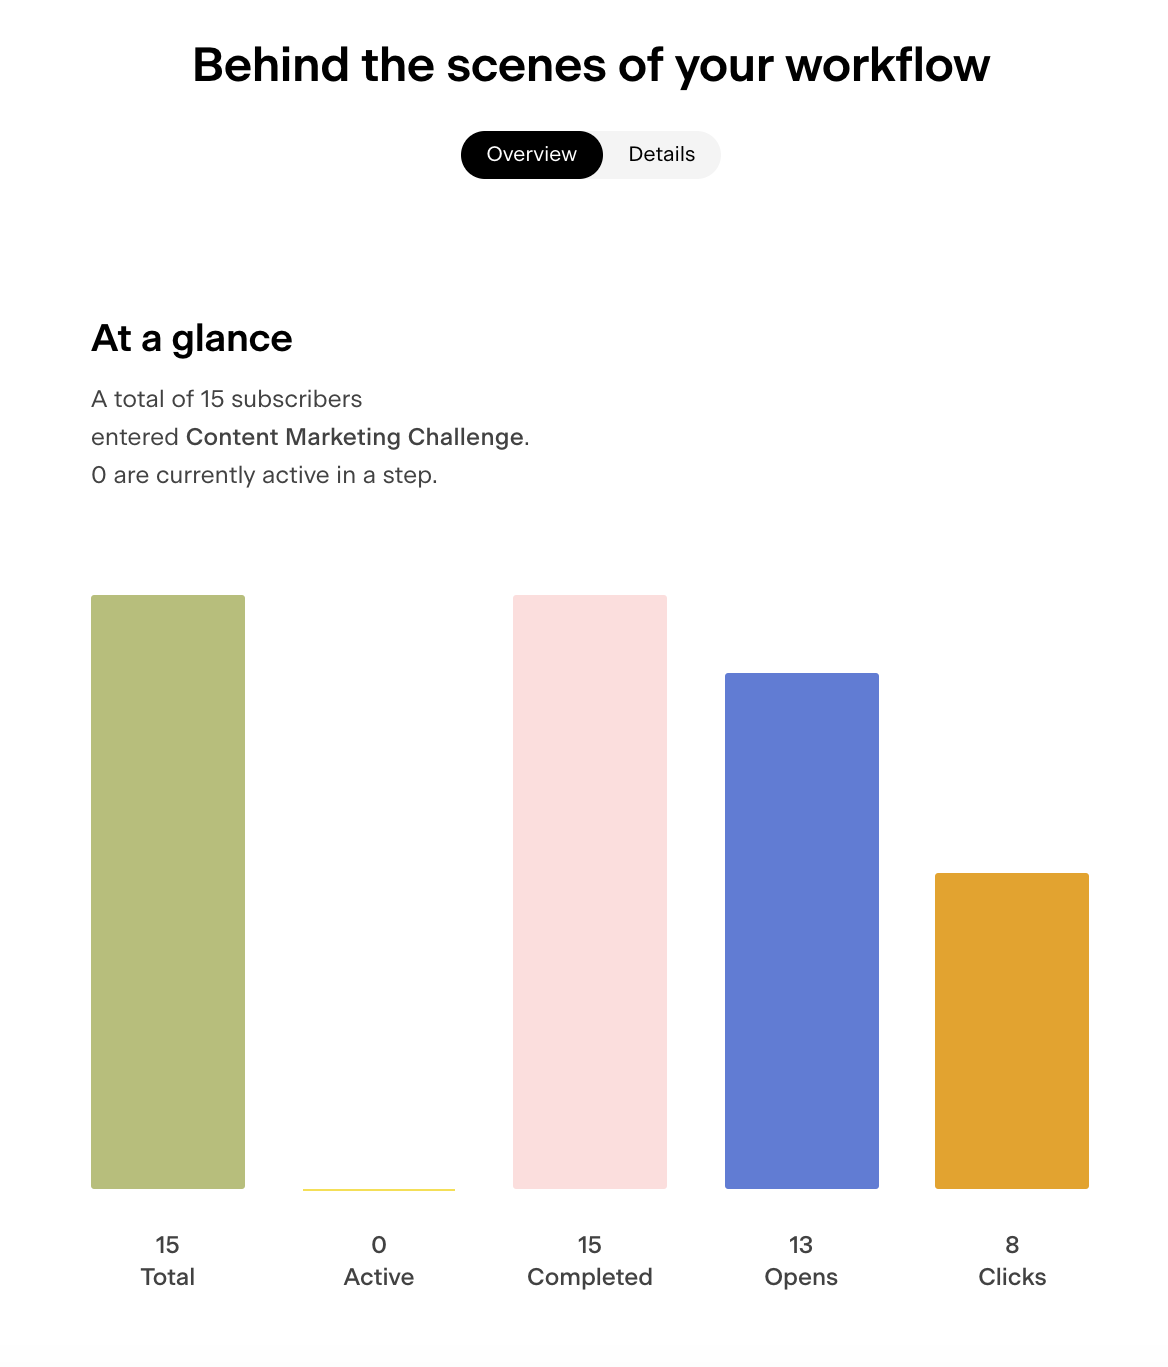
Click on each bar graph column metric (like Opens or Clicks) to view a list of subscribers behind the data and apply bulk actions.
You can also download this data as a CSV file.
How to identify subscribers who clicked a specific link in your workflow
On your Workflows dashboard, click the analytics icon on the workflow card and then select View details.
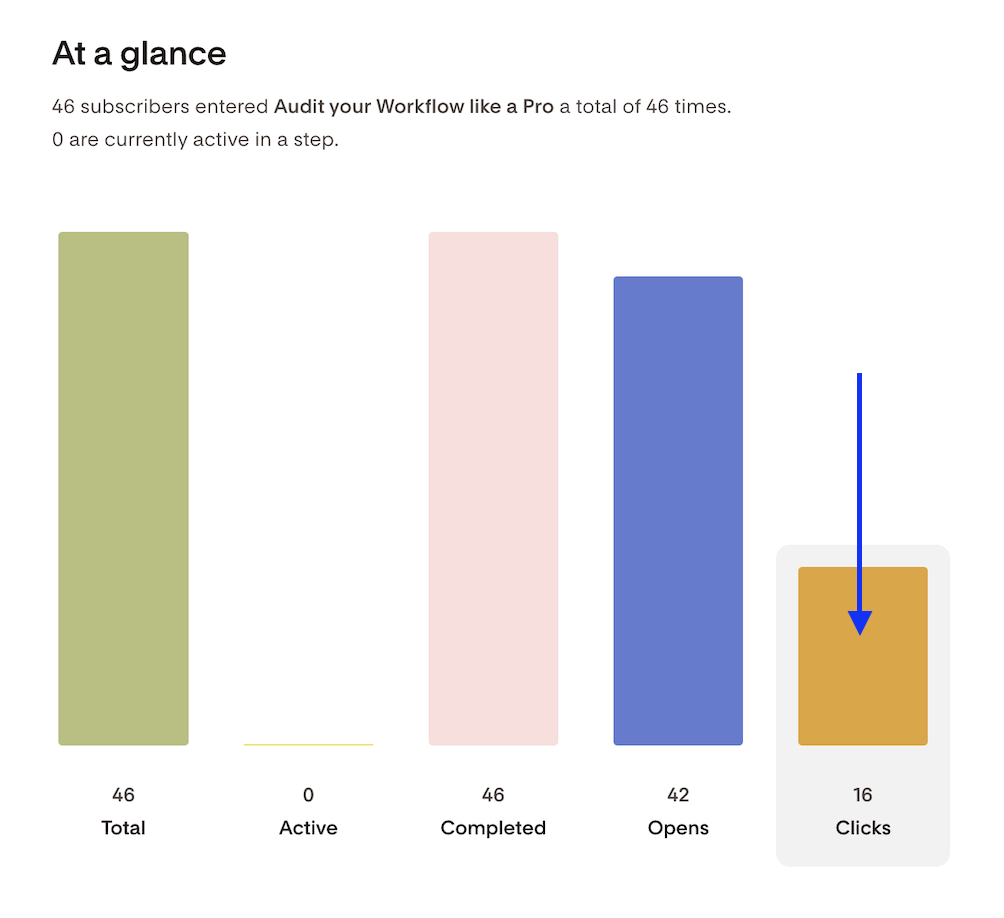
Under the At a glance section, click on the Clicks bar of the graph.
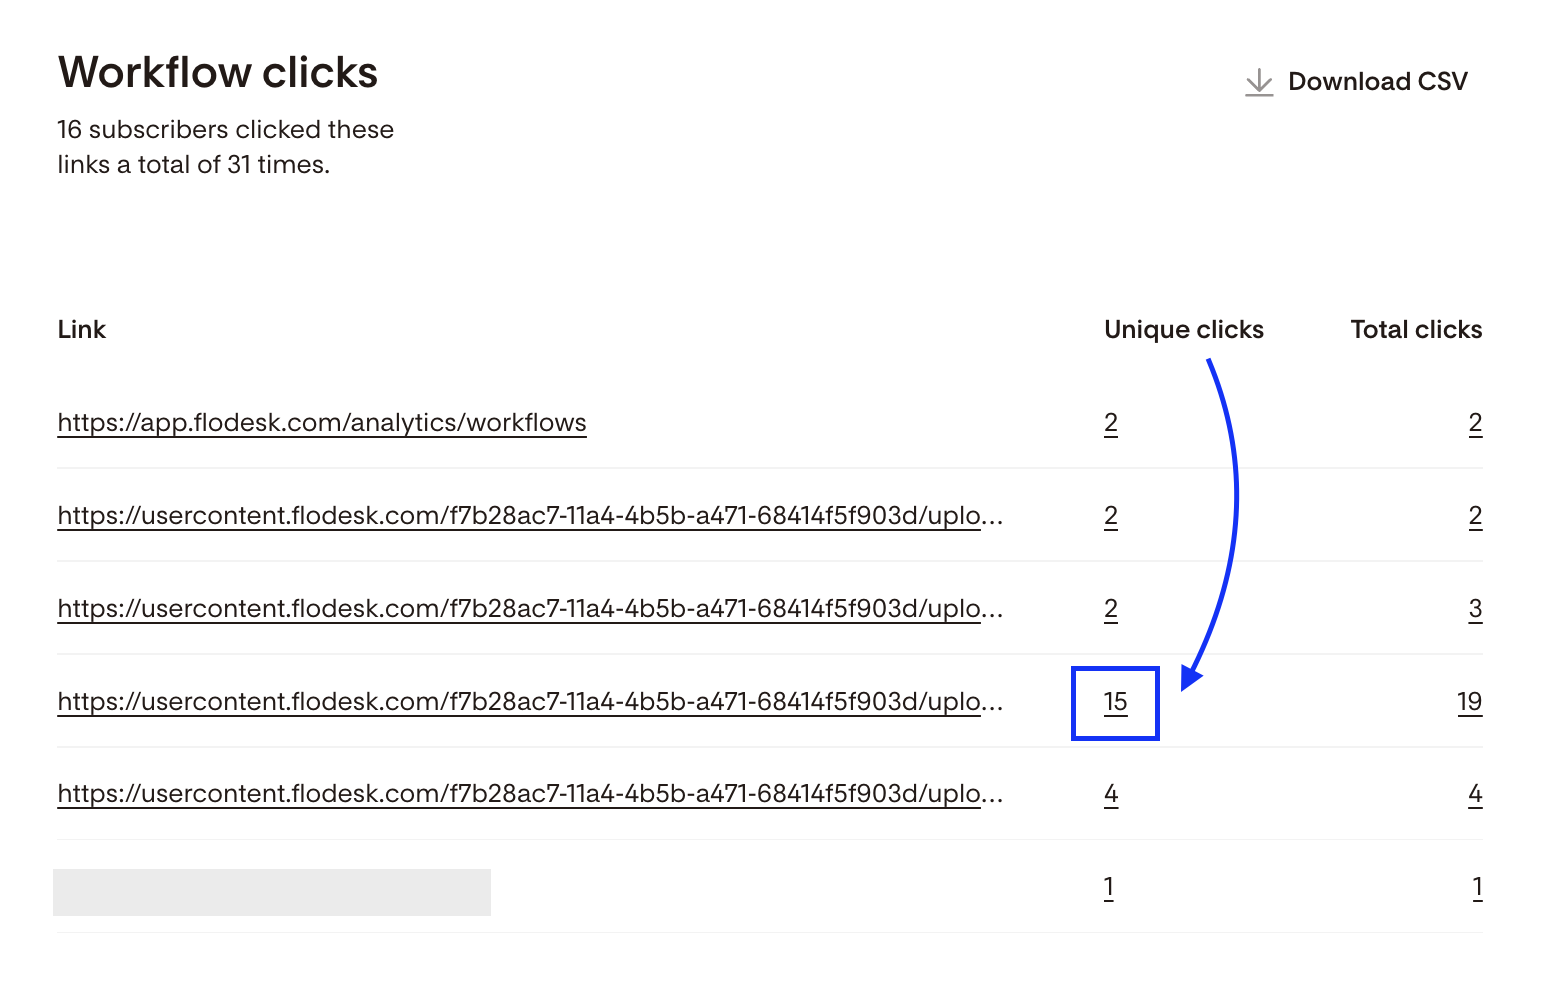
The next screen will list all links in your workflow, showing both Unique clicks and Total clicks. Click on the number of Unique clicks next to the link (URL) you're interested in.
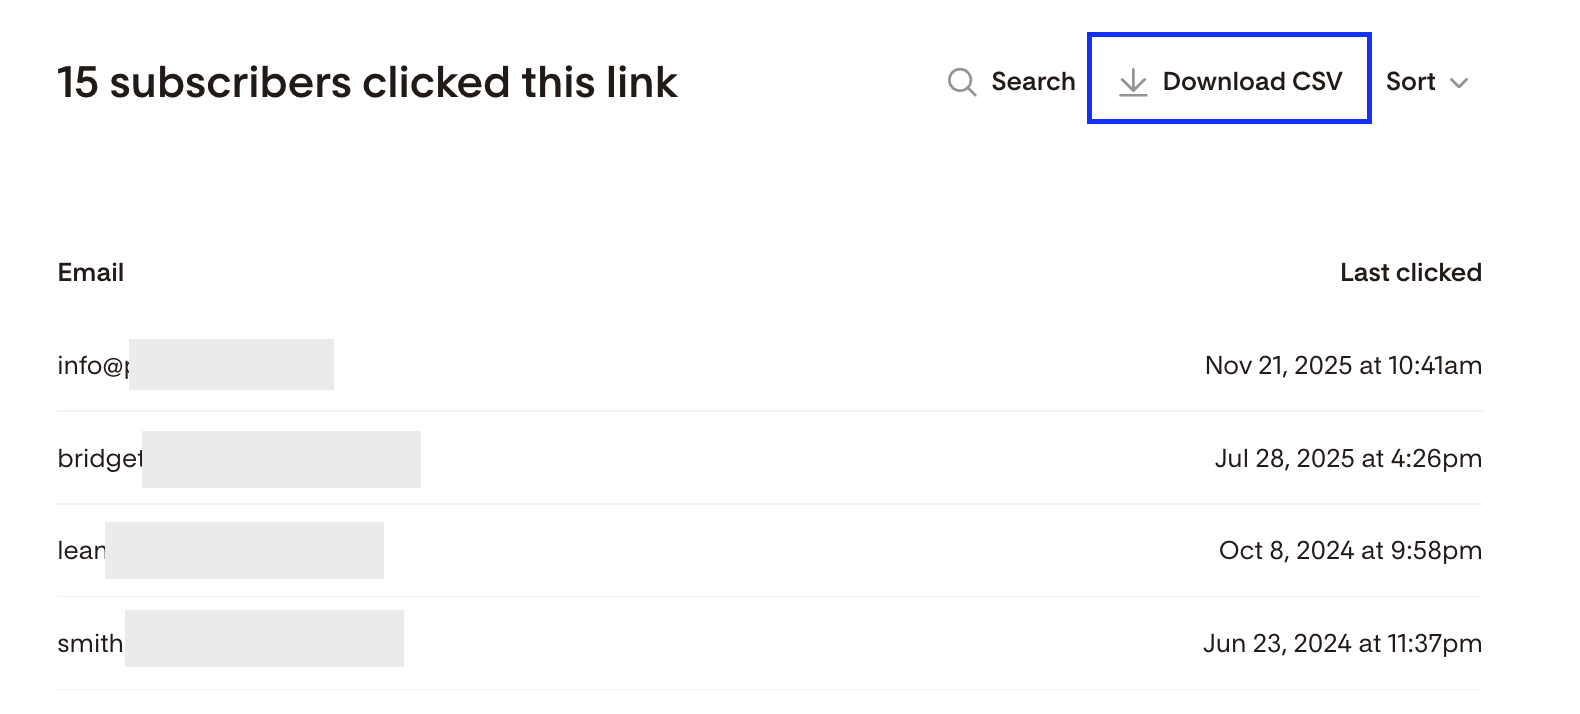
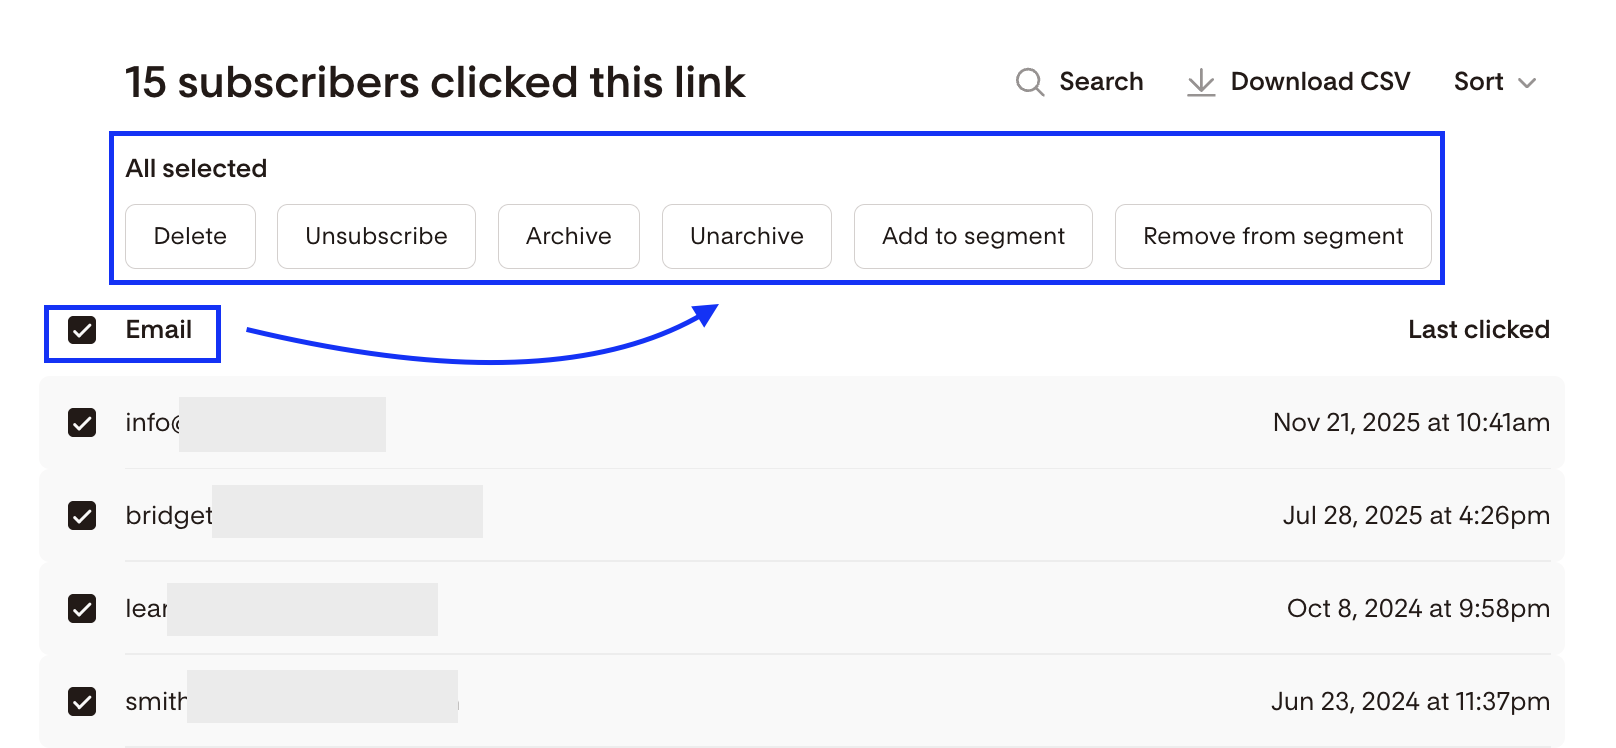
You will see a list of all subscribers who clicked that specific link. From here, you can
Download a CSV of this subscriber list or
Apply bulk actions by selecting the tickbox next to the Email column header
Engagement metrics
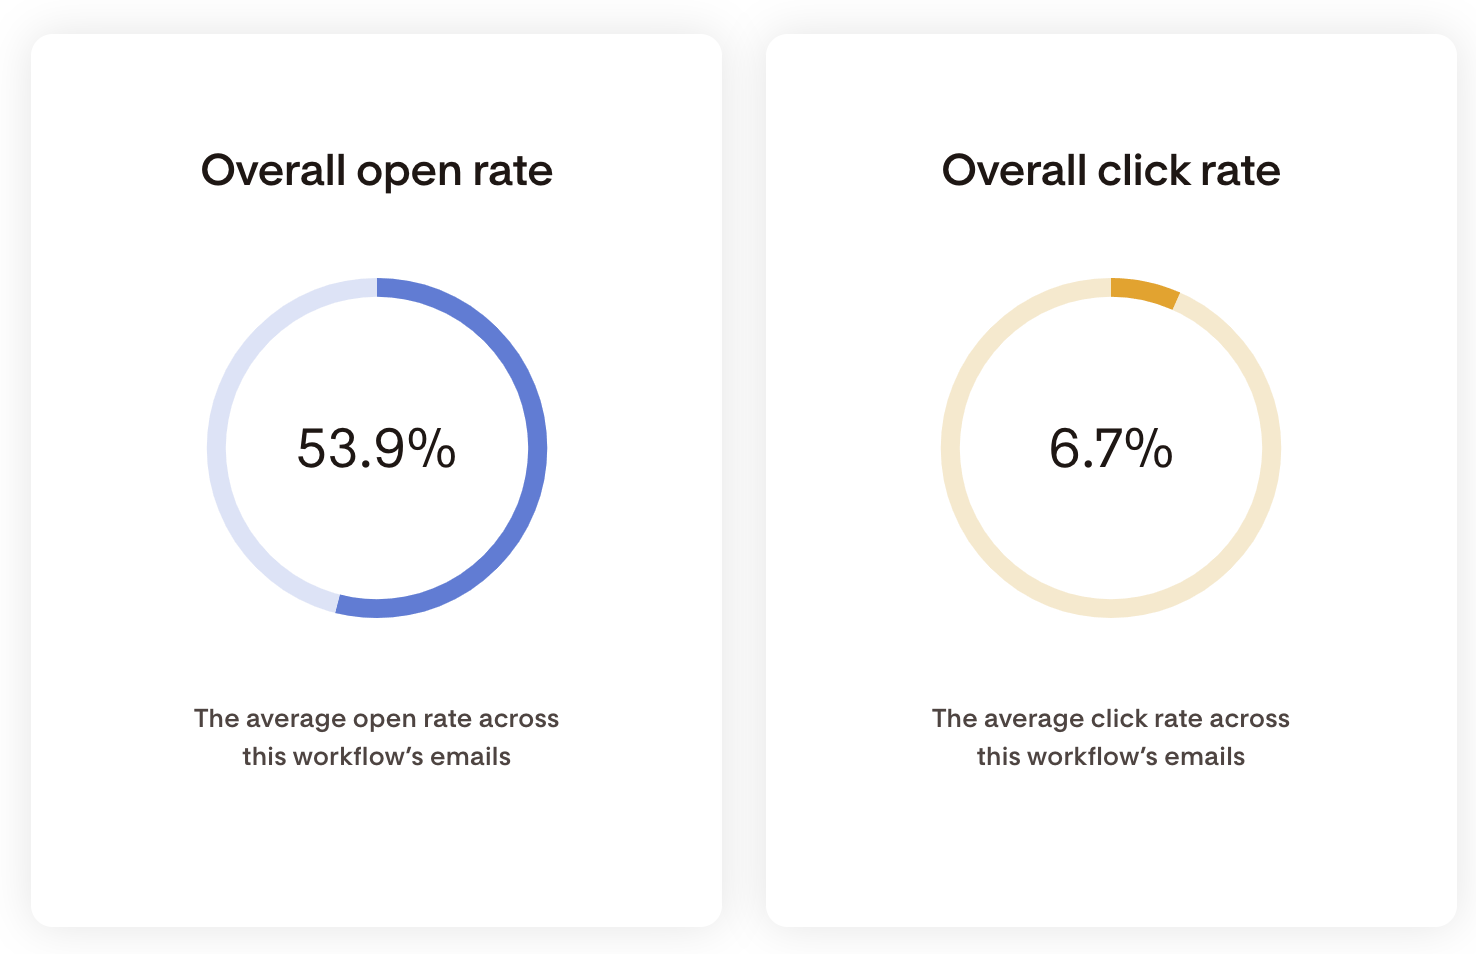
Overall open rate (%)
Overall click rate (%)
These give you a sense of how well your workflow content is resonating with subscribers.
Device breakdown
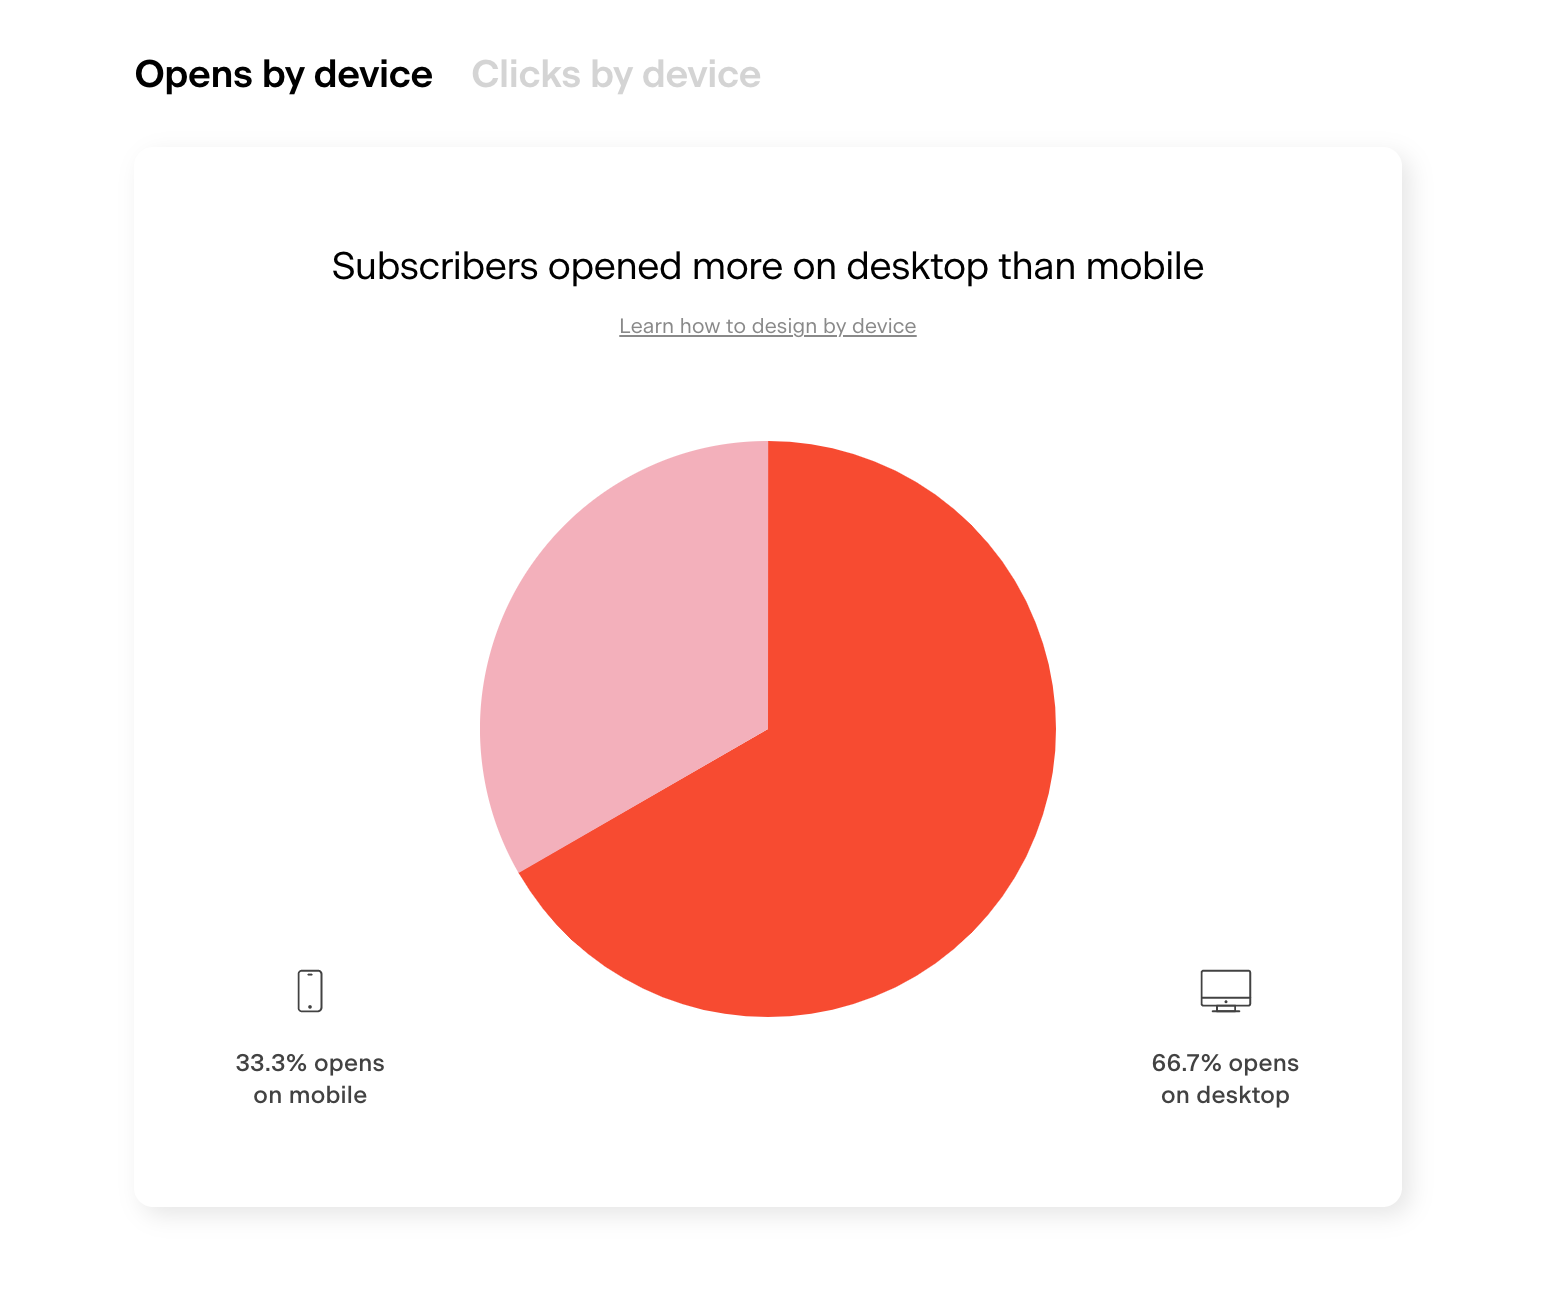
See where your subscribers are reading your emails:
Desktop vs. Mobile
Knowing this can help you tailor your future workflow emails for the most common device type.
To learn how to design emails by preferred device type, check out Email design best practices for desktop and mobile.
Details Tab
Want to zoom in on each step in your workflow? Head to the Details tab.
Here, you’ll find:
A list of all steps in this workflow
Email-specific performance metrics: Sends, Opens, Clicks
Click any step’s bar graph icon to drill deeper.
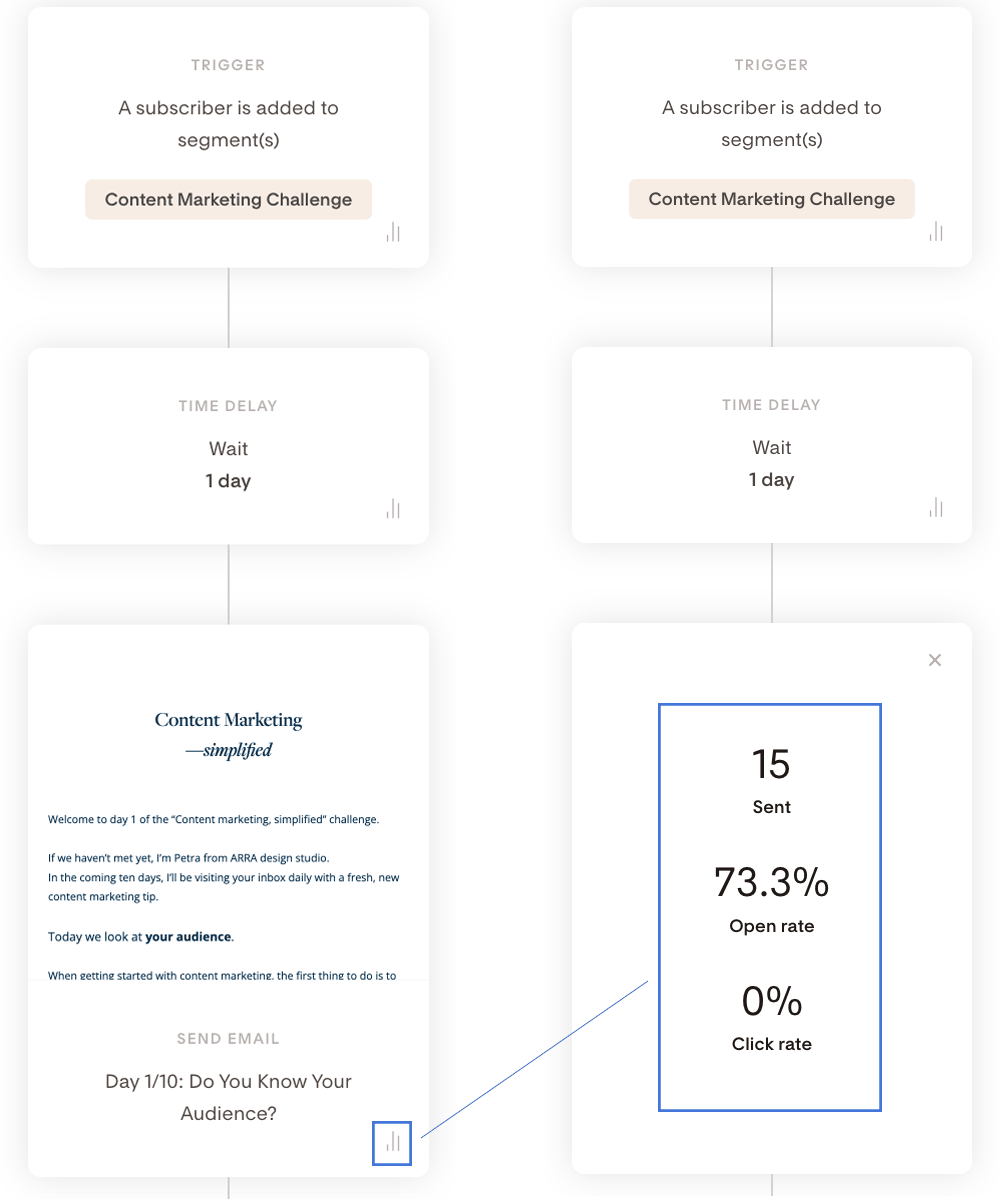
View subscriber-level details
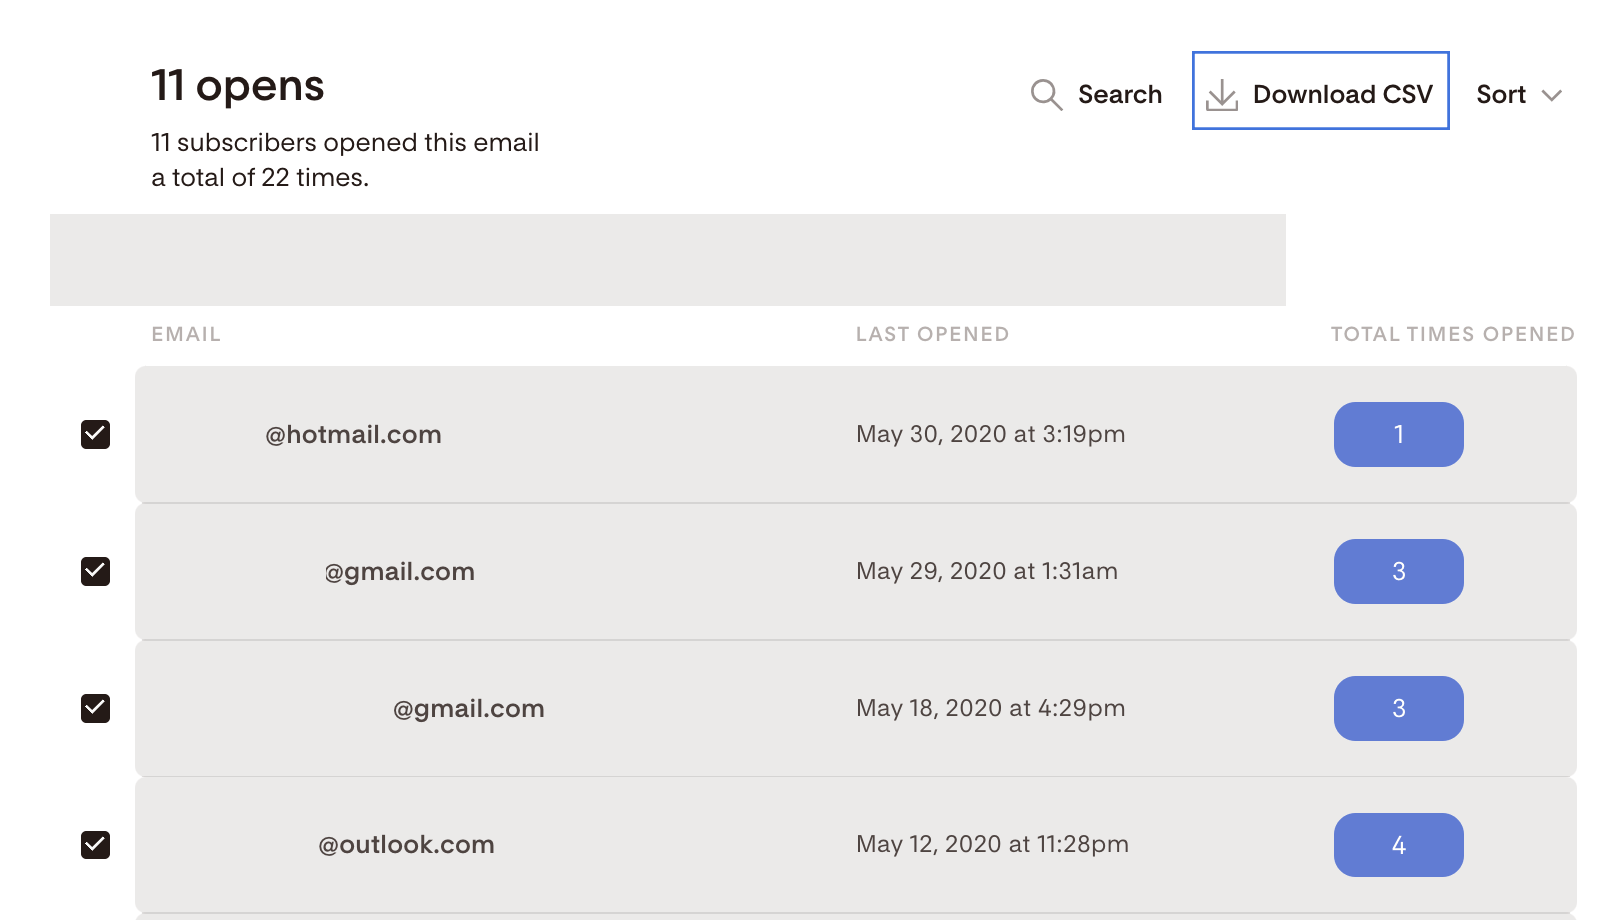
Click any metric (e.g., Opened) to view the subscribers behind the number
Apply bulk actions or download subscriber data as a CSV
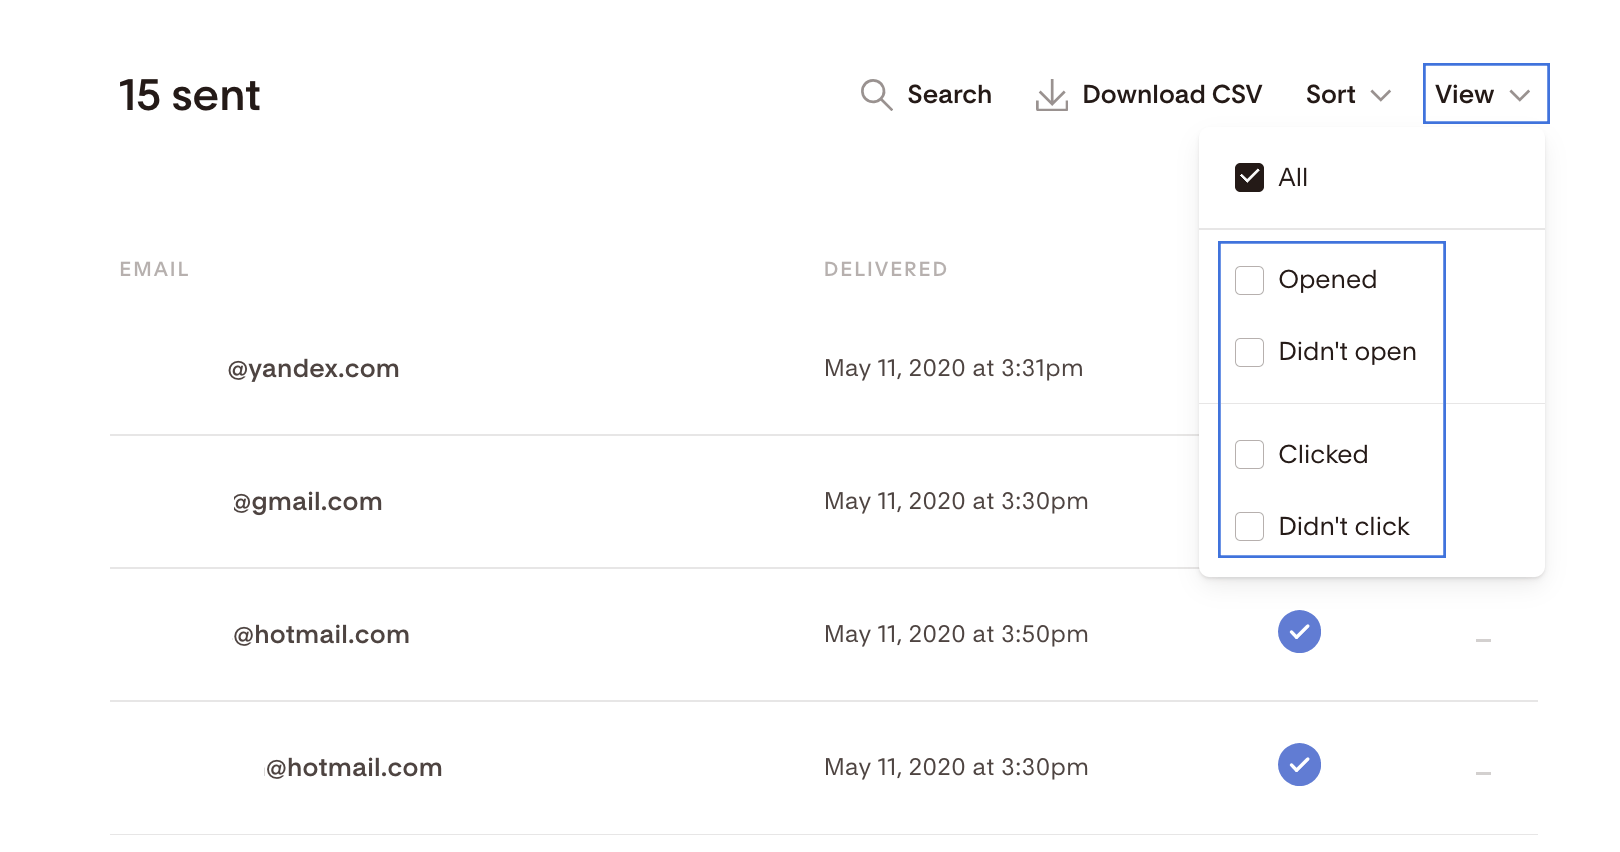
If you click on the Sent figure, you also have the option to view subscribers based on opened, didn't open, clicked, didn't click.
Summary
Here’s how to check how your workflow performed:
Go to Workflows dashboard
Click the bar graph icon on any published workflow
Click View details
Use the Overview tab for a big-picture view of your workflow
Use the Details tab to analyze performance by step and email
Flodesk makes it easy to understand what’s working and what needs improving so you can optimize your automations and connect with your audience more effectively.