
Product analytics vs. sales page analytics
Overview
Flodesk gives you two distinct views for tracking how your products and pages are performing: product-level analytics and sales page analytics. This article explains what each view shows, where to find it, and how it differs from your legacy checkout analytics if you've been selling on Flodesk before Products launched.
Note: this feature is being released in batches. Right now, Products is available to new members who haven't created a checkout before. If you’re an existing Flodesk member who has existing checkouts, you'll be invited to try Products soon, and switching will always be your choice. Nothing will be migrated automatically.
How analytics are organized
Analytics in Flodesk are split into three distinct areas, each with its own entry point. None of the three pull data from the others automatically.
Analytics > Products: The primary home for all product-level sales data. This is where you track revenue, orders, and conversion rates for every product in your catalog.
Sales page analytics: Accessed from within the Checkouts dashboard by clicking on the analytics icon on a sales page card and selecting View report. Shows sales page-level performance and a breakdown of how each product on that page is converting.
Analytics > Checkouts (legacy): Only visible to members who have existing legacy checkout history. Shows historical data tied to legacy checkout IDs, unchanged from how it worked before Products launched.
If you're new to Flodesk and have never published a legacy checkout, you'll only see Analytics > Products. The Checkouts tab won't appear in your Analytics navigation.
Product analytics: Analytics > Products
This is your go-to view for understanding how individual products are performing across your entire catalog, regardless of which sales page or campaign drove the sale.
From your Flodesk dashboard, click Analytics > Products.
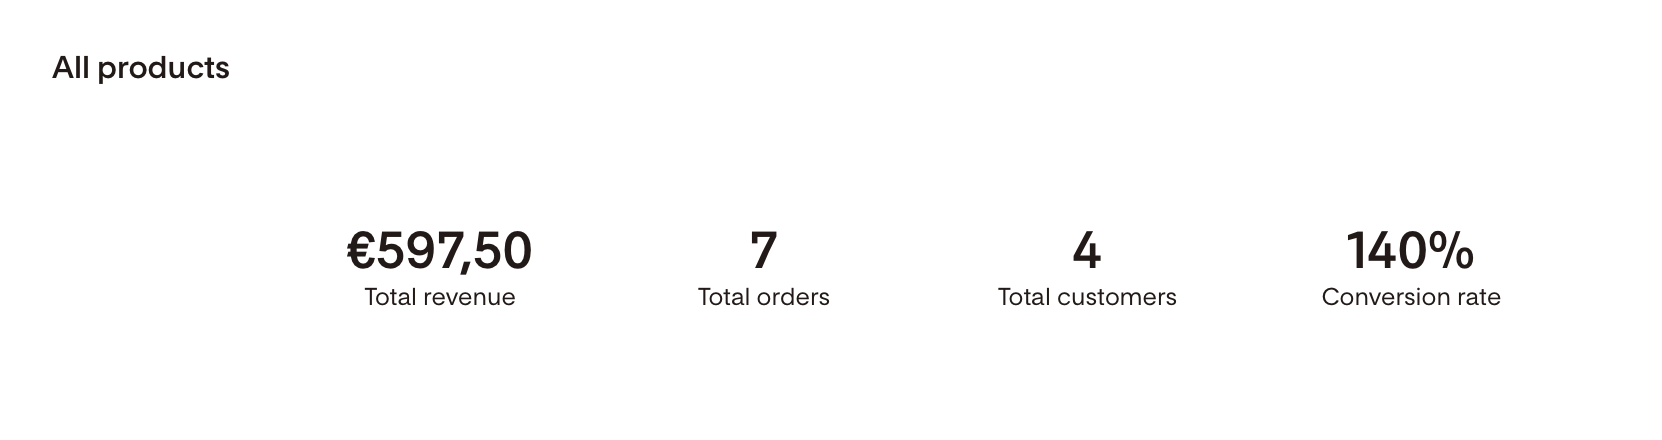
All products
The first section gives you an overview across all your products, including
Total revenue
Total orders
Total customers
Conversion rate
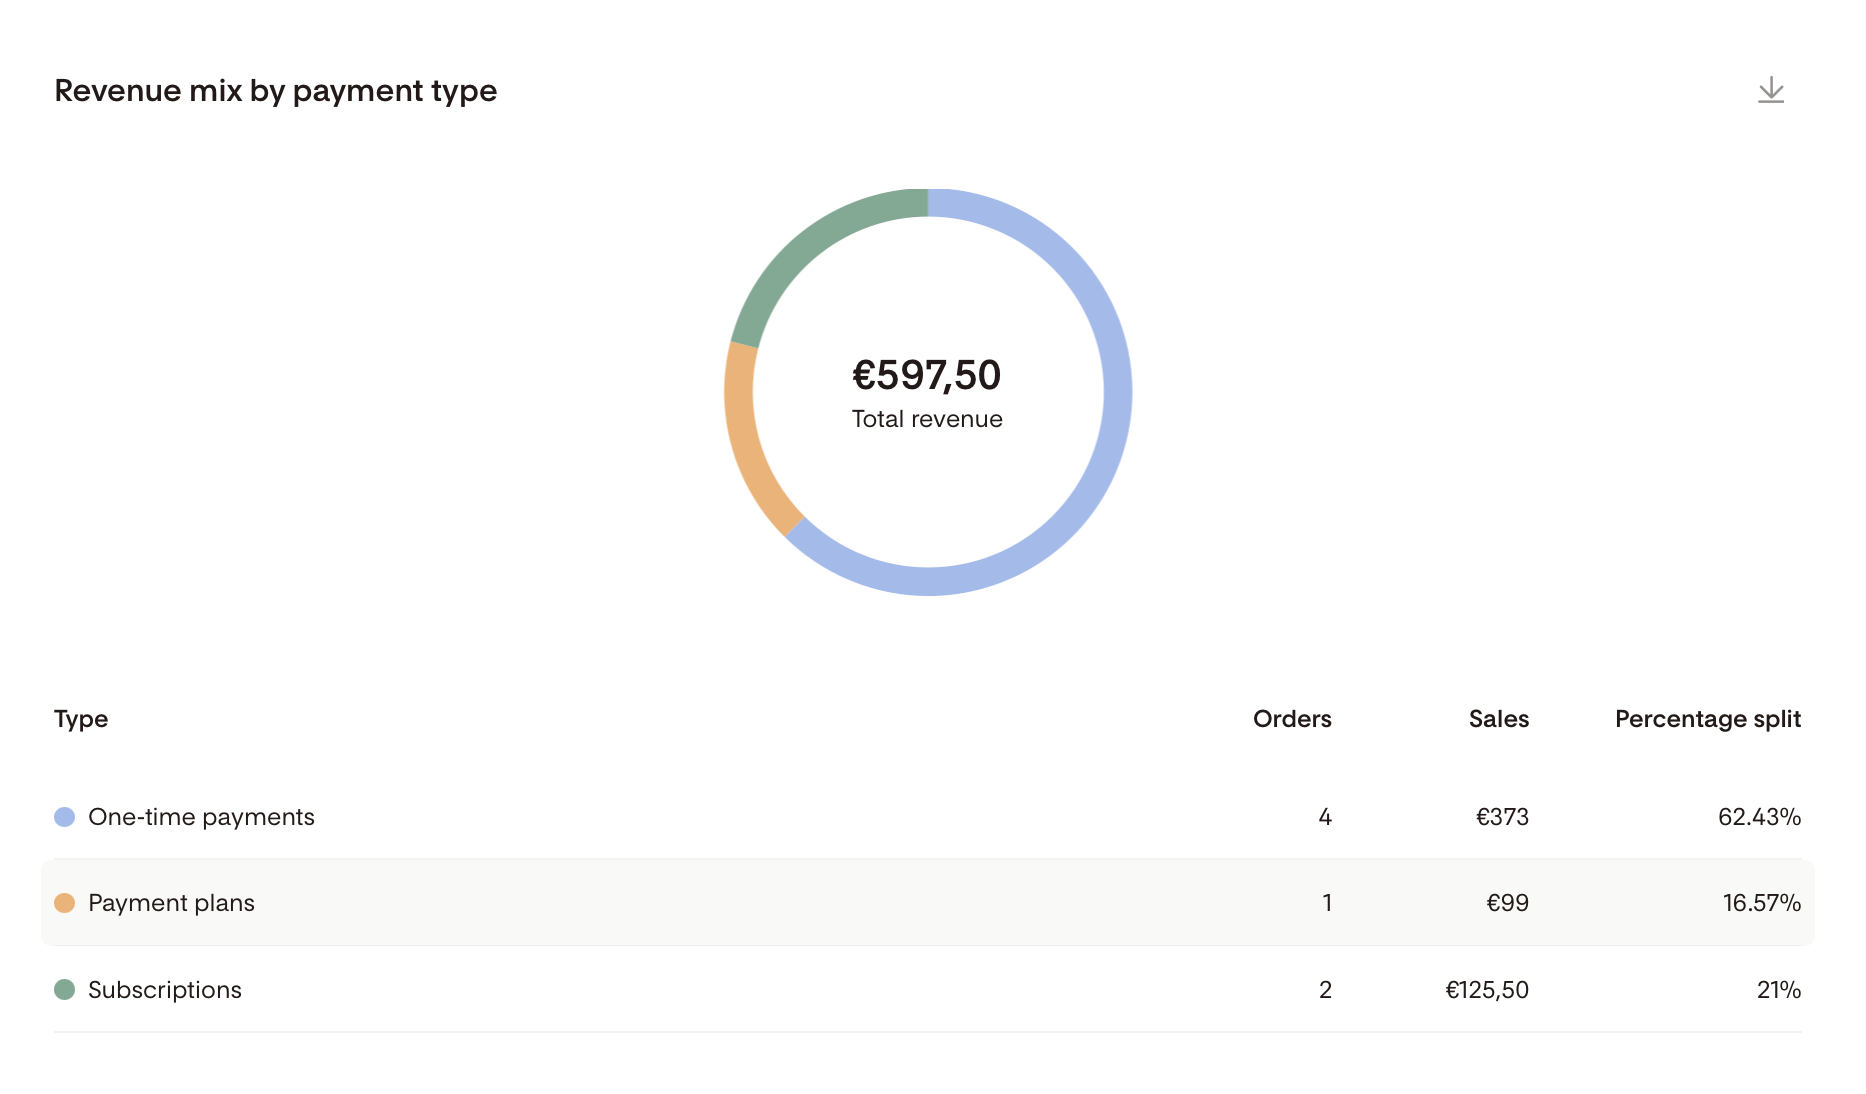
Revenue mix by payment type
The next section breaks down revenue by payment type:
One-time payments
Payment plans
Subscriptions
You can export the data into a CSV by clicking the download icon in the top right corner of this section.
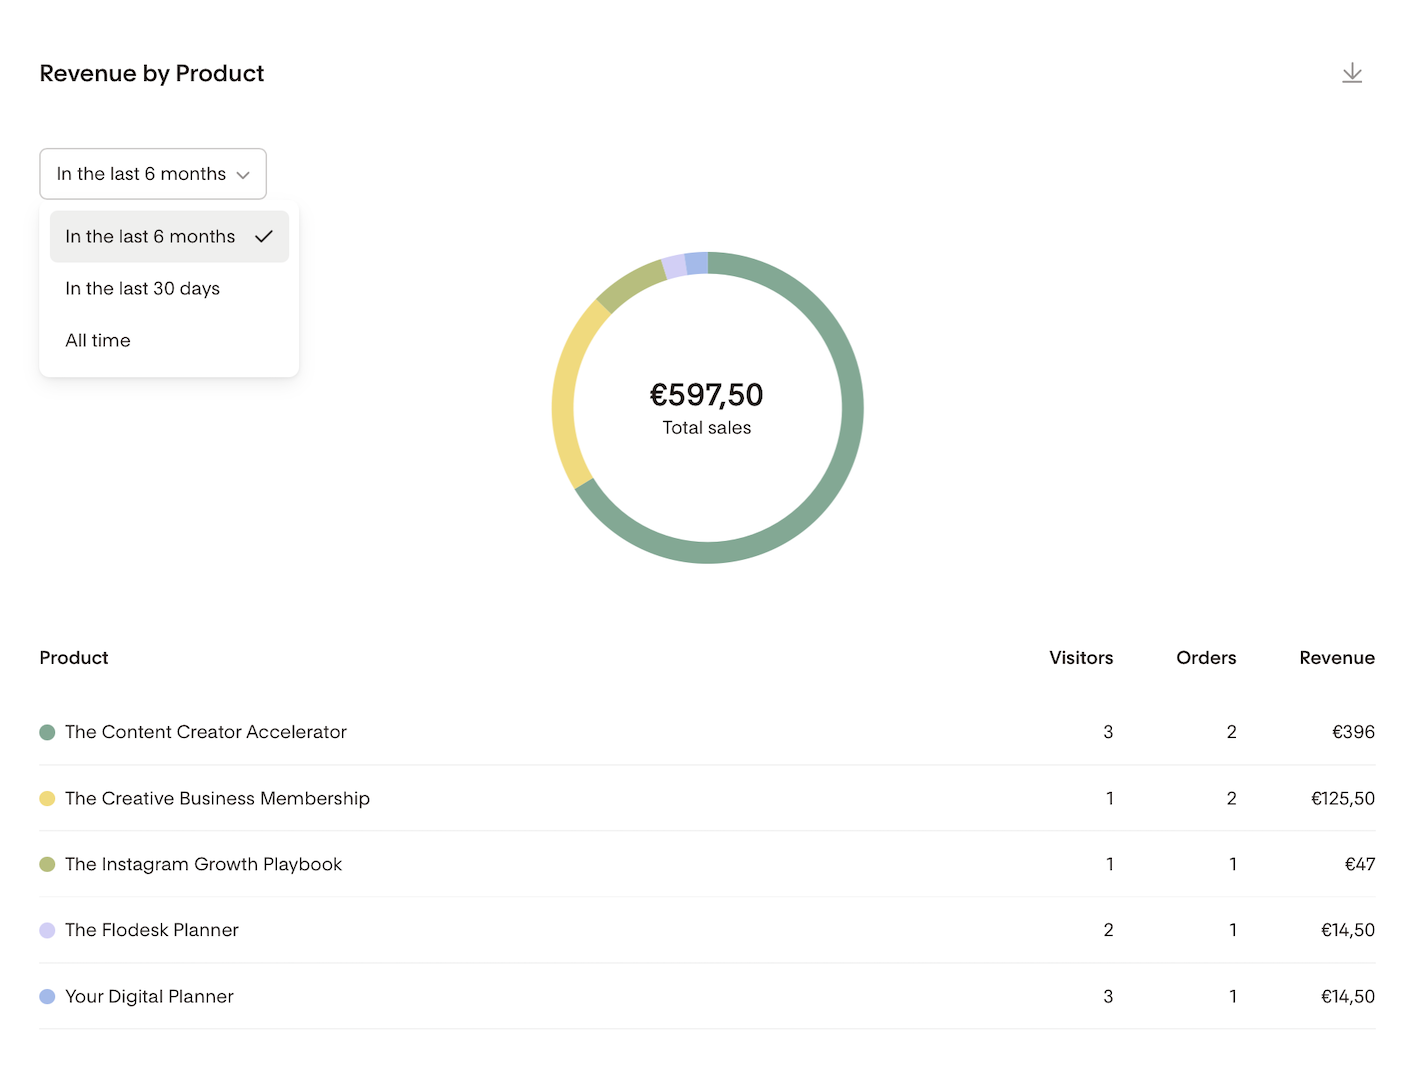
Revenue by Product
The following chart shows revenue broken down by product in the last 30 days, in the last 6 months or all time.
You can export the data into a CSV by clicking the download icon in the top right corner of this section.
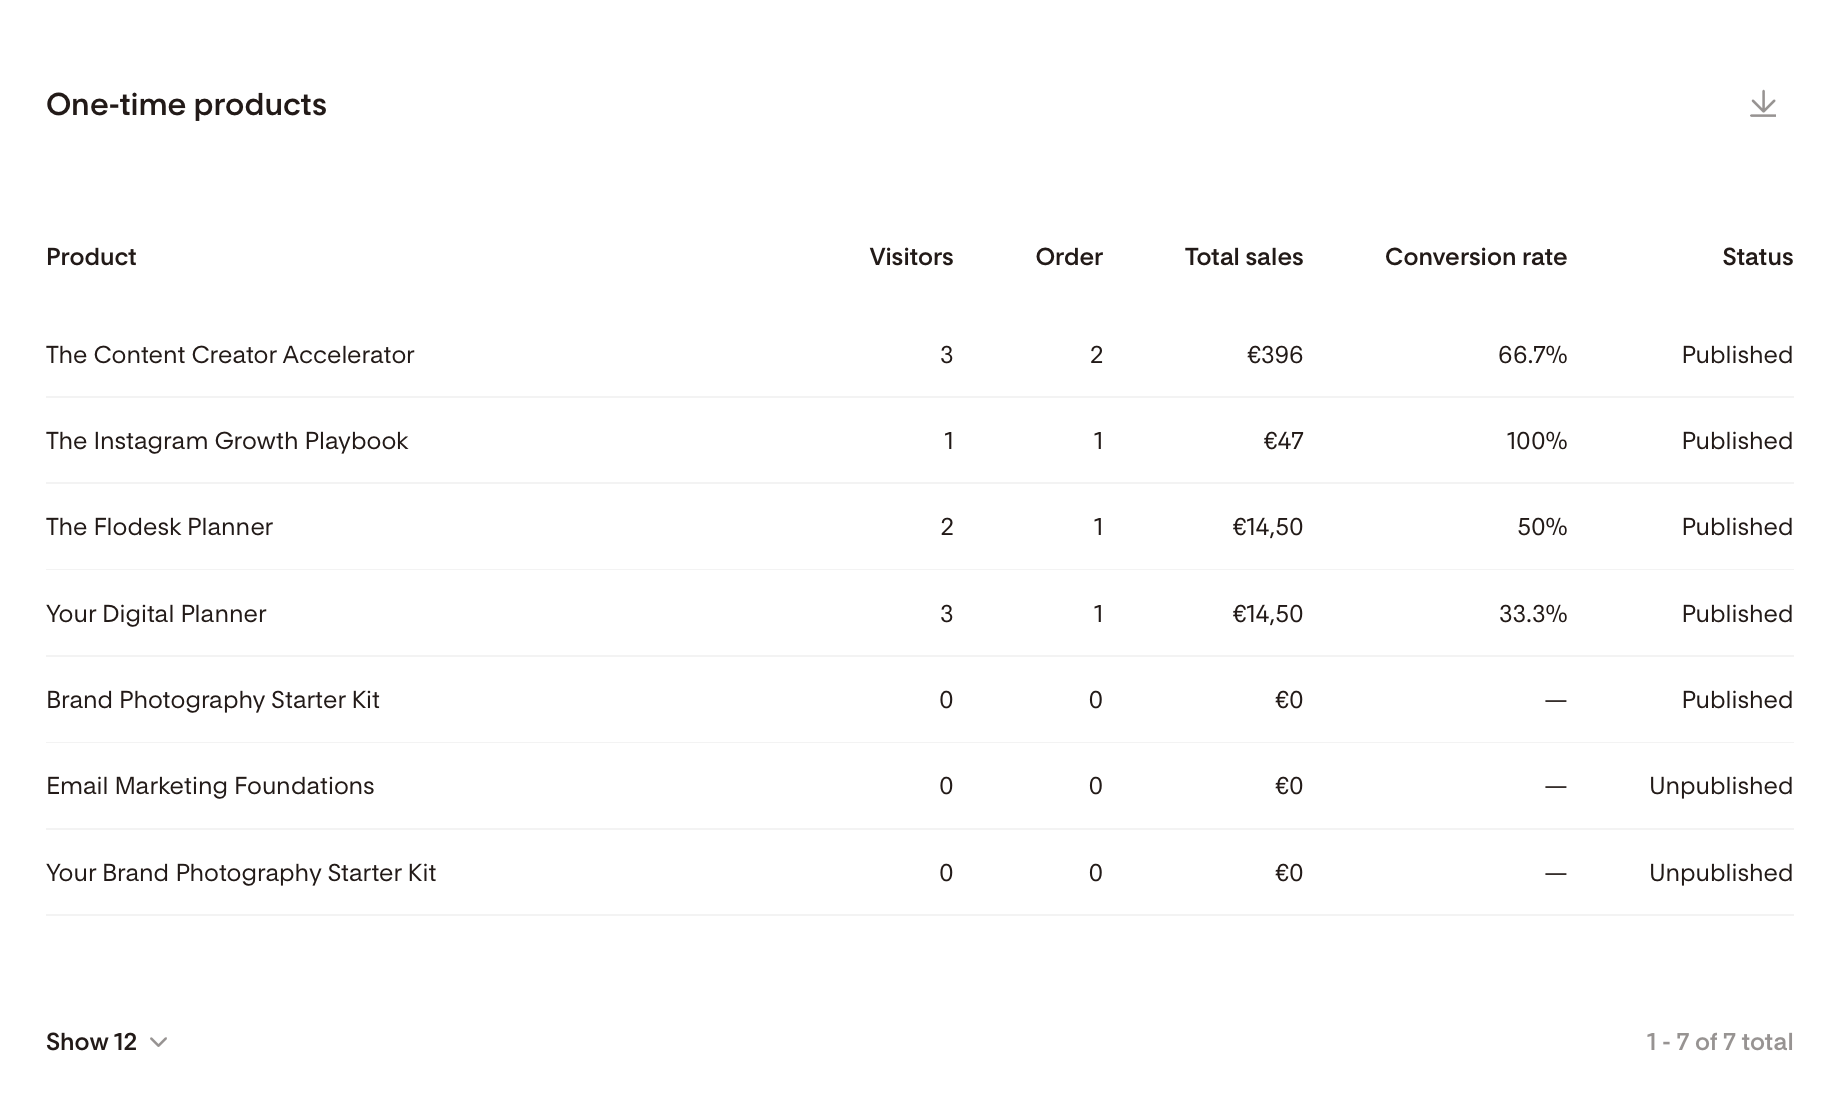
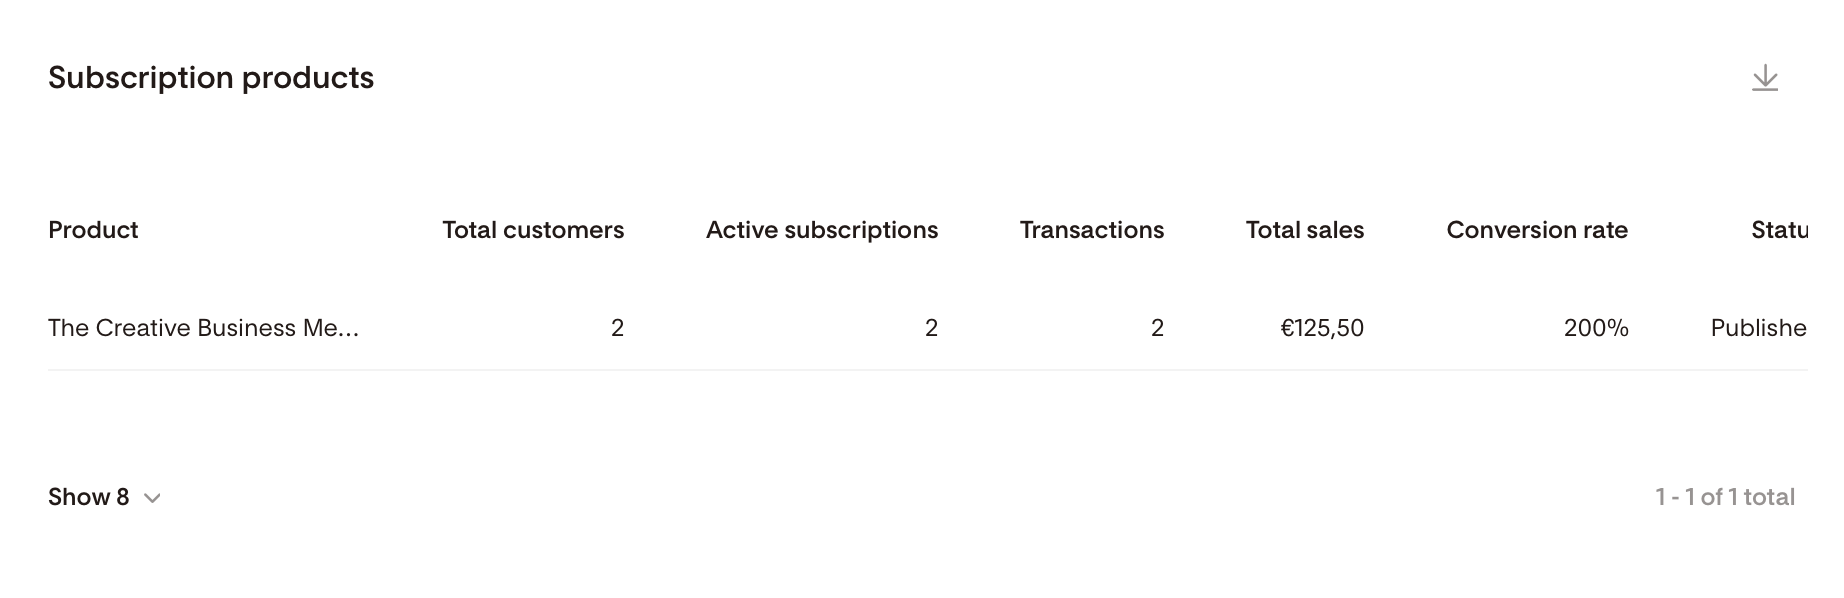
At the bottom of the Products Analytics page, you’ll find two tables comparing key details across your One-time products, including those with payment plans (visitors, order, total sales, conversion rate, status) and Subscription products (total customers, active subscriptions, transactions, total sales, conversion rate, status).
The status column shows whether a product is currently published or unpublished. A product can still show past sales data even after it's unpublished, if it had sales while it was live.
Sales page analytics
On your Checkouts dashboard, click on the analytics icon on a sales page card and select View details to see sales page-level performance and a breakdown of how each product on that page is converting.
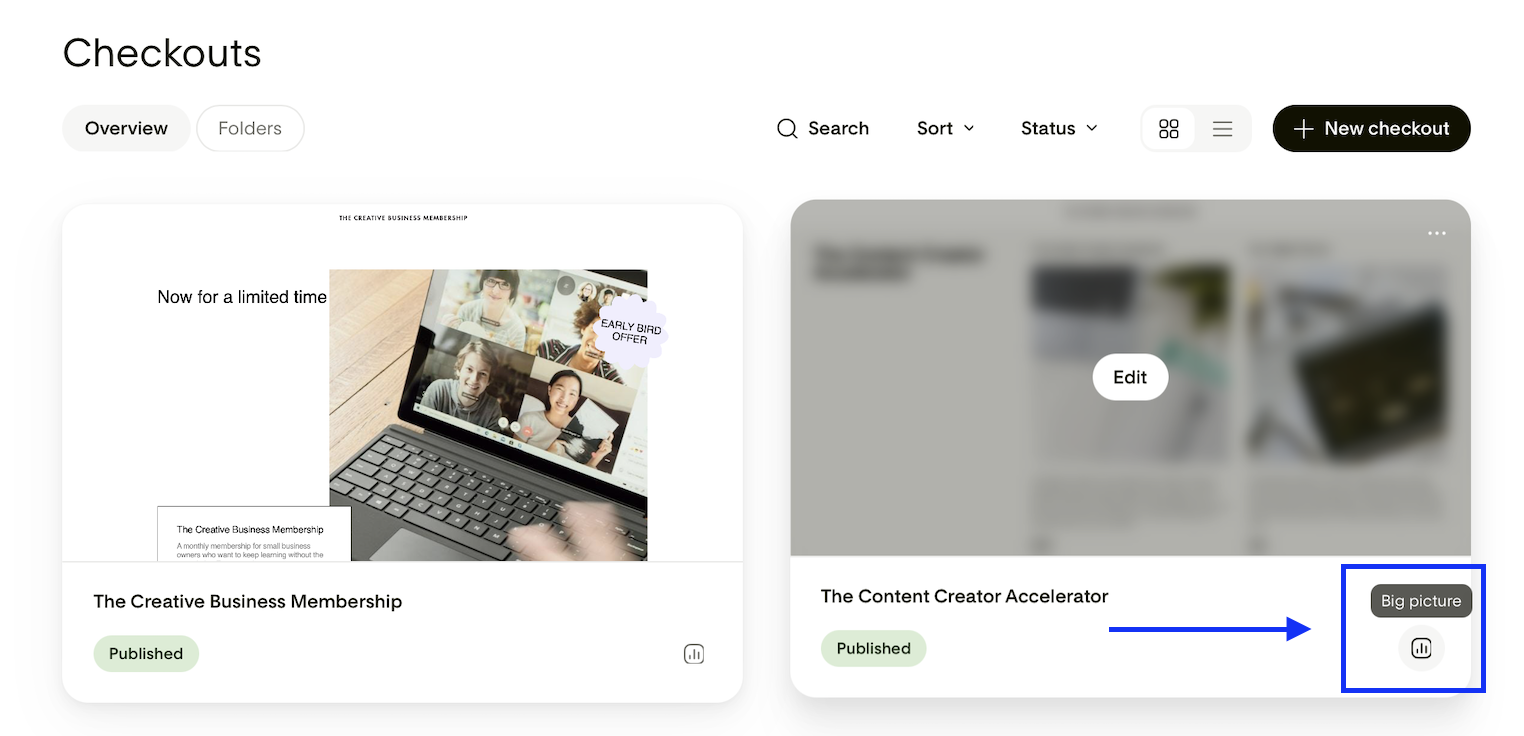
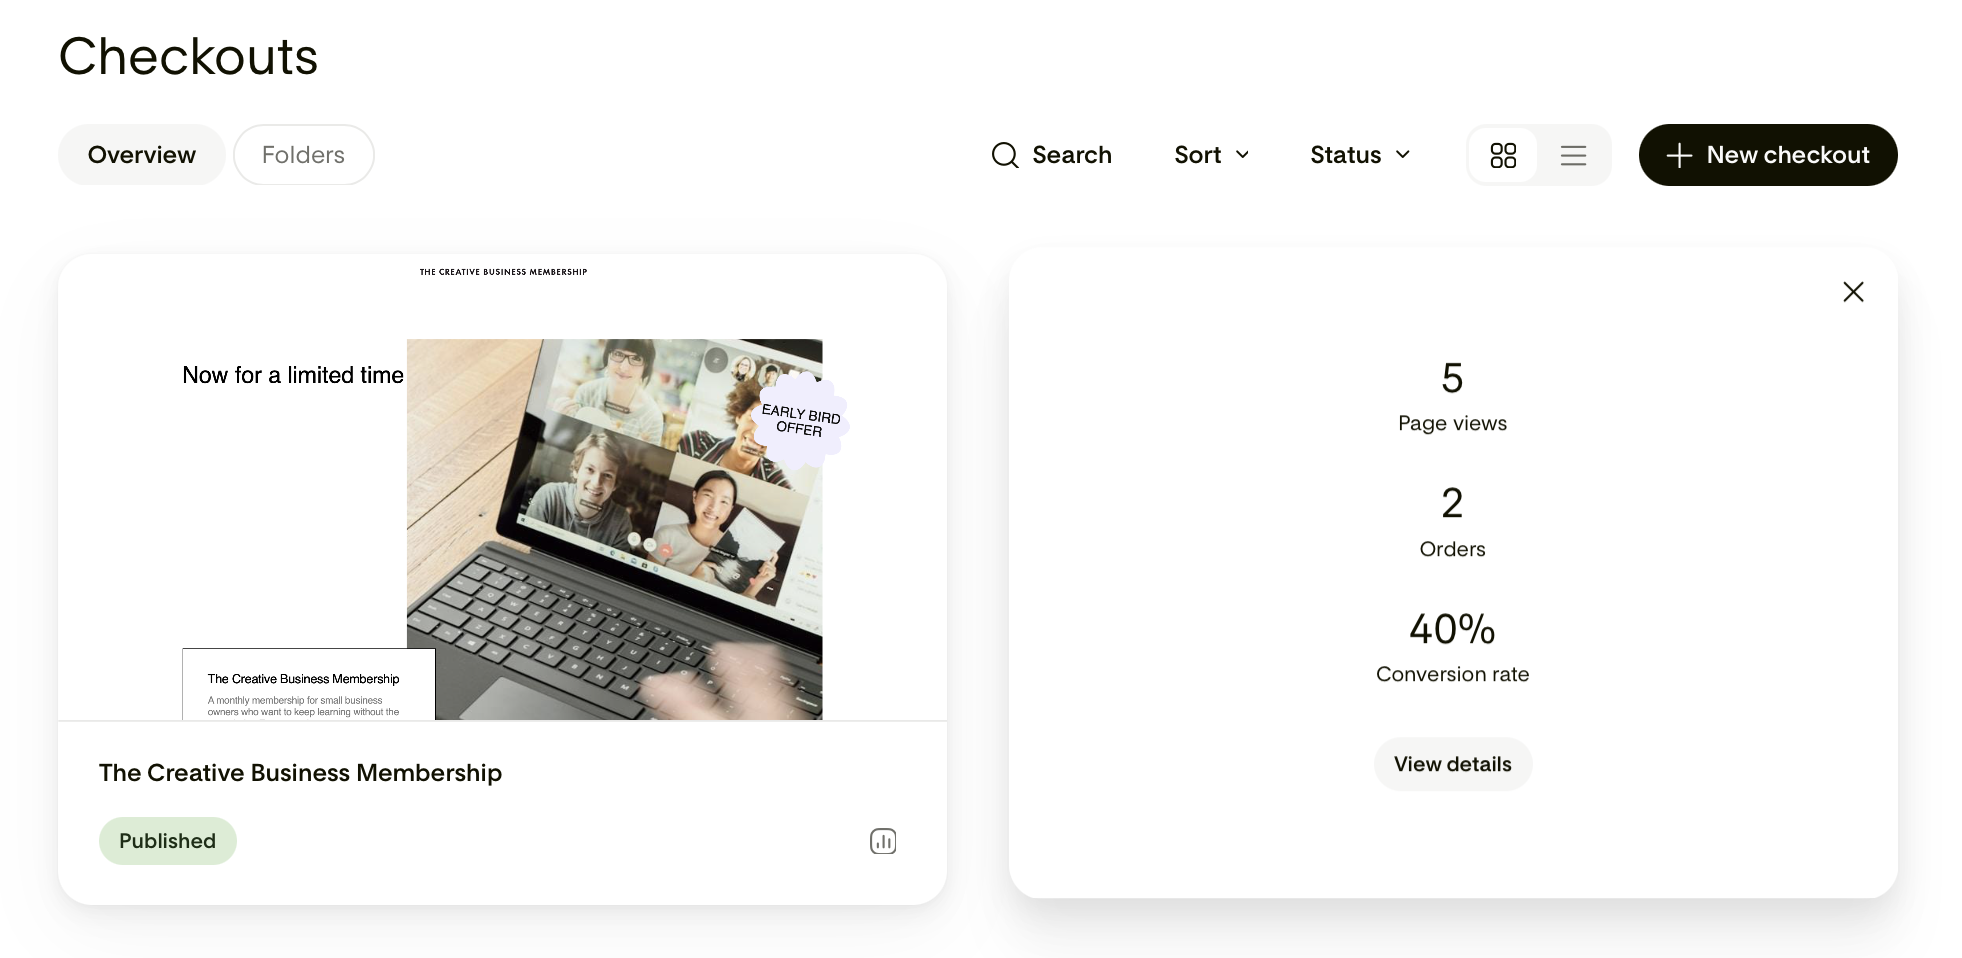
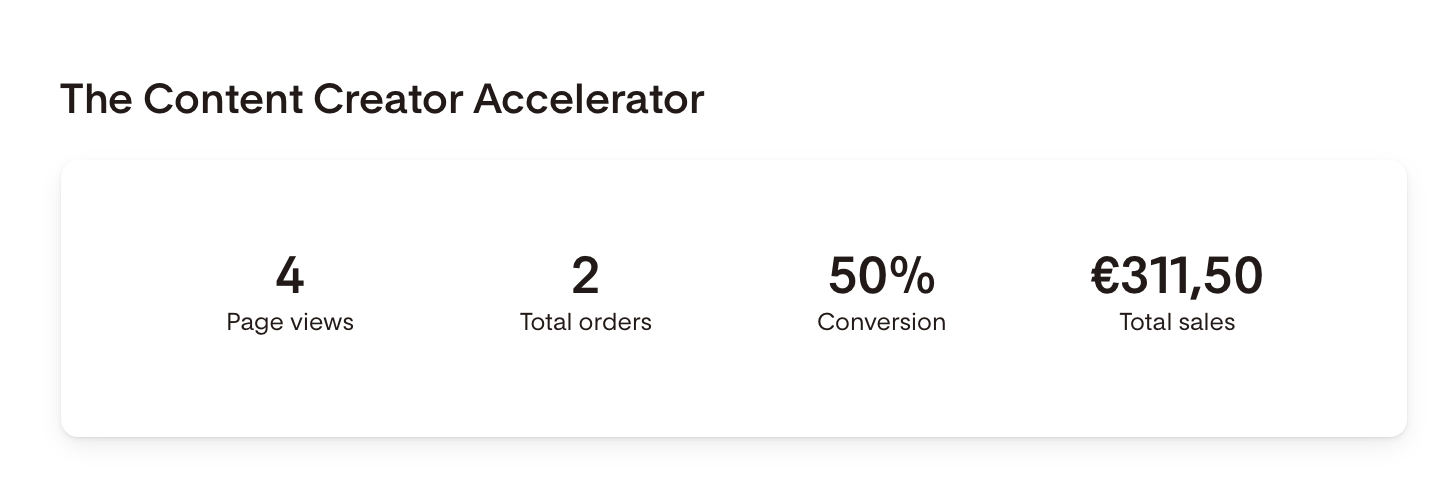
You’ll see your sales page overview at the top, including page views, total orders, conversion and total sales.
Next, you’ll see all the products that are on this sales page, showing how each product block converts, from clicks to purchase.
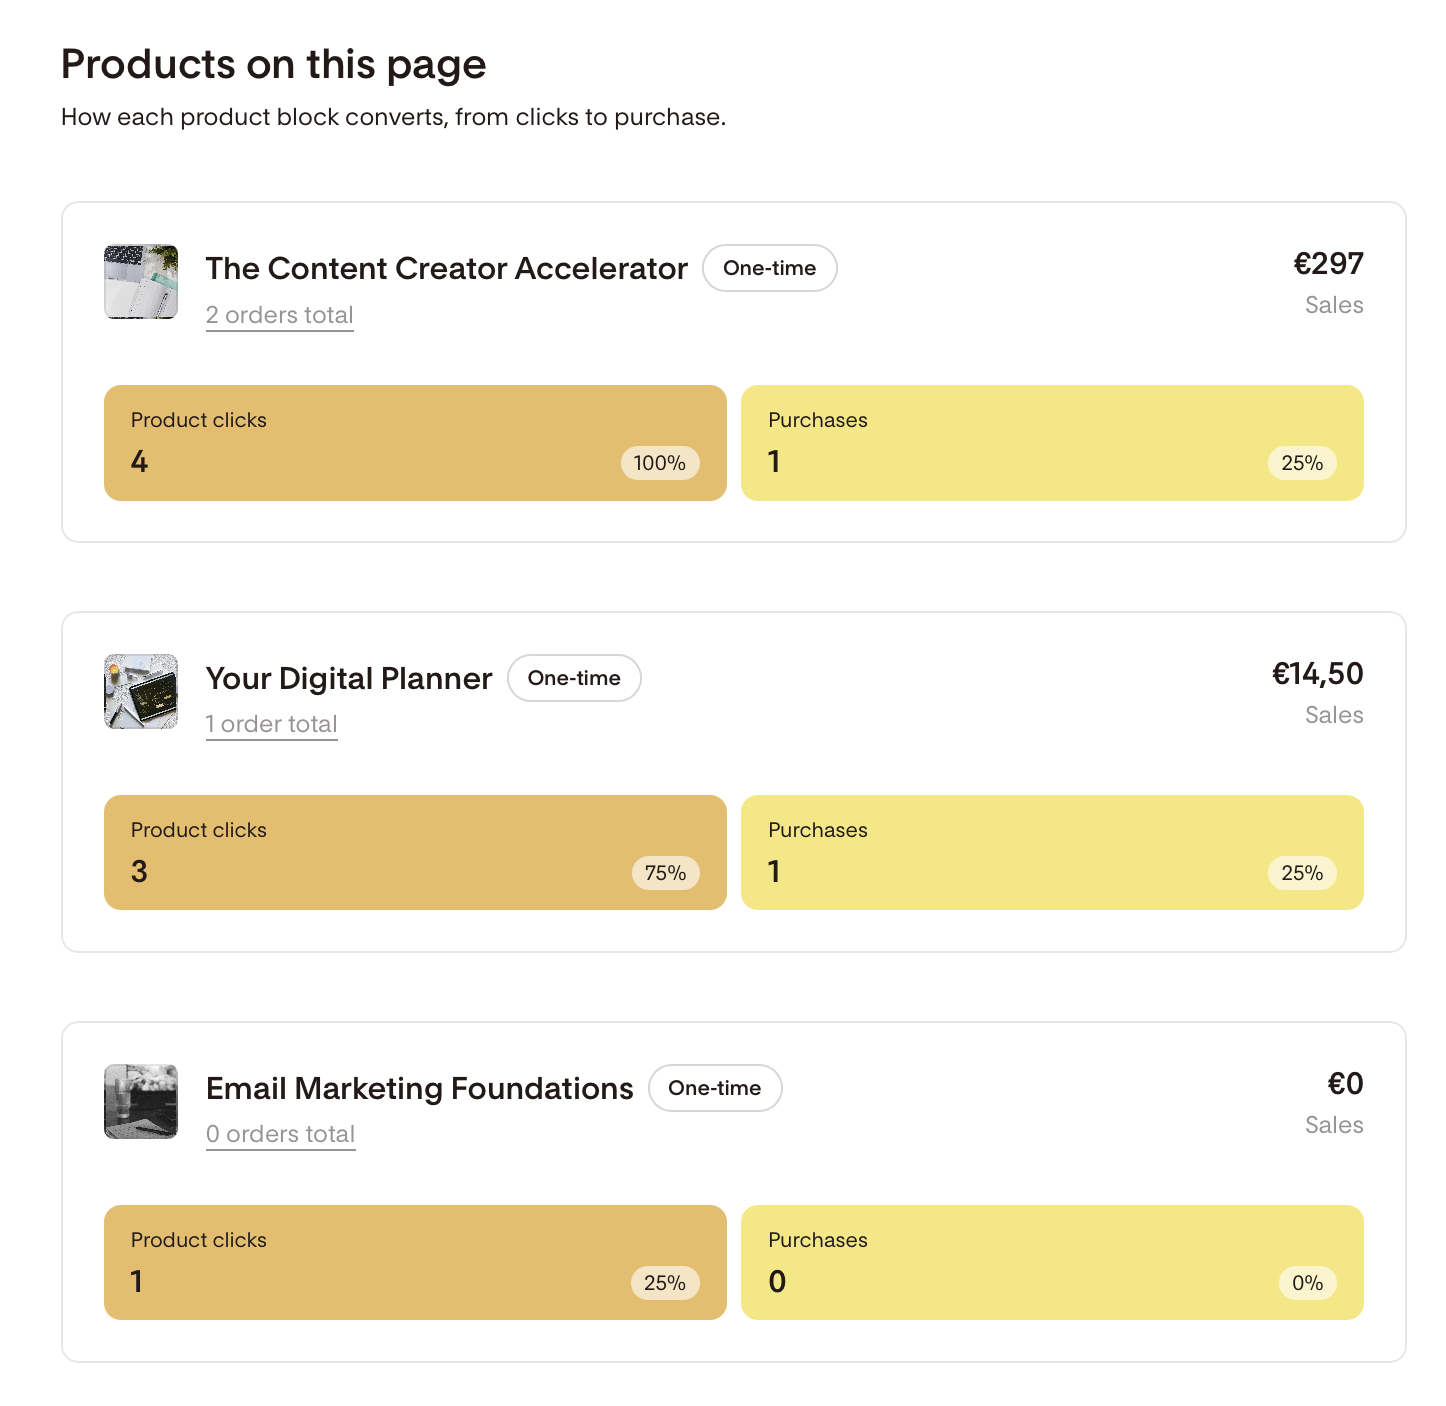
You can click the “orders total” link on any of the products to land on the Per-product detail view. Each product has its own detail view with tabs that adapt based on the product's payment type.
For one-time and payment plan products
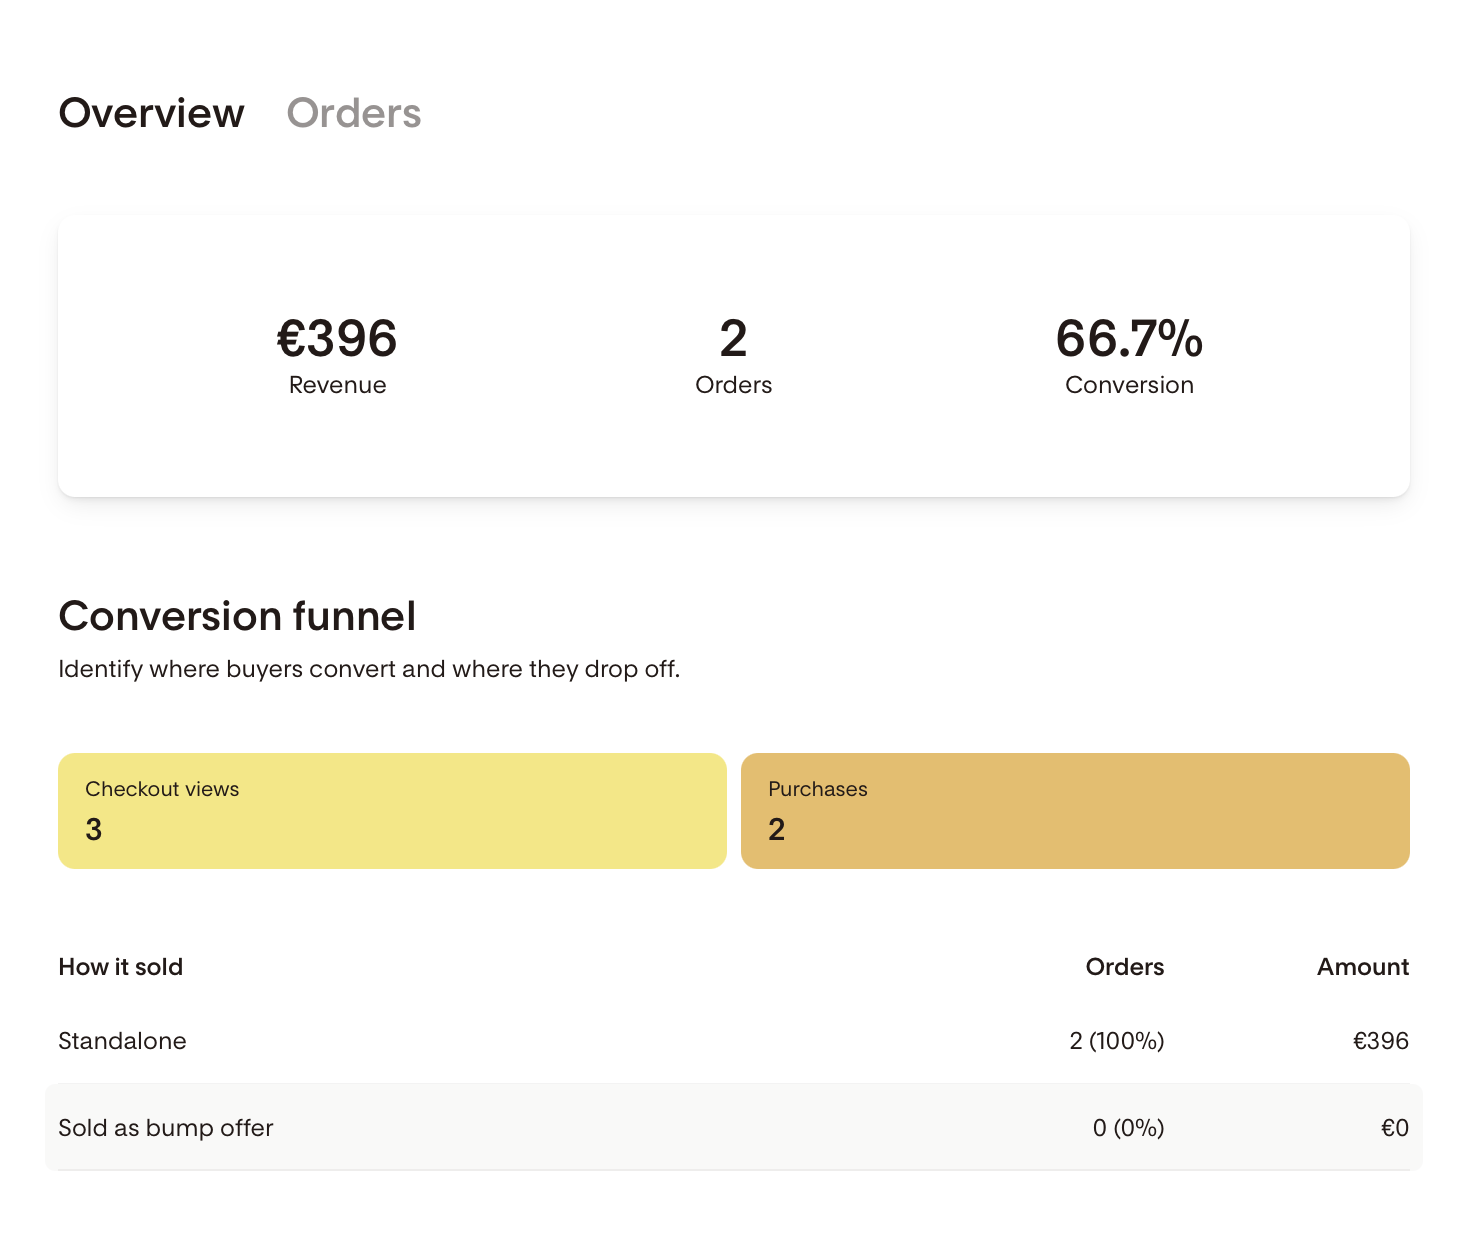
Tab 1: Overview
The overview tab shows your top-level performance metrics for this product:
Revenue: Total amount collected for this product.
Orders: Total number of completed transactions.
Conversion rate: Completed transactions divided by checkout page visitors.
All three metrics include a delta showing how performance compares to the prior period.
Below the hero metrics, you'll see a conversion funnel showing two stages:
Stage 1 (where applicable): Sales page views to checkout clicks. This stage is shown when the product is linked to a sales page.
Stage 2 (always shown): Checkout page views to completed payments. This is the core product-level conversion metric.
Below the funnel, a table shows how the product sold: as a standalone purchase, or as a bump offer (an upsell shown during another product's checkout).
Tab 2: Orders
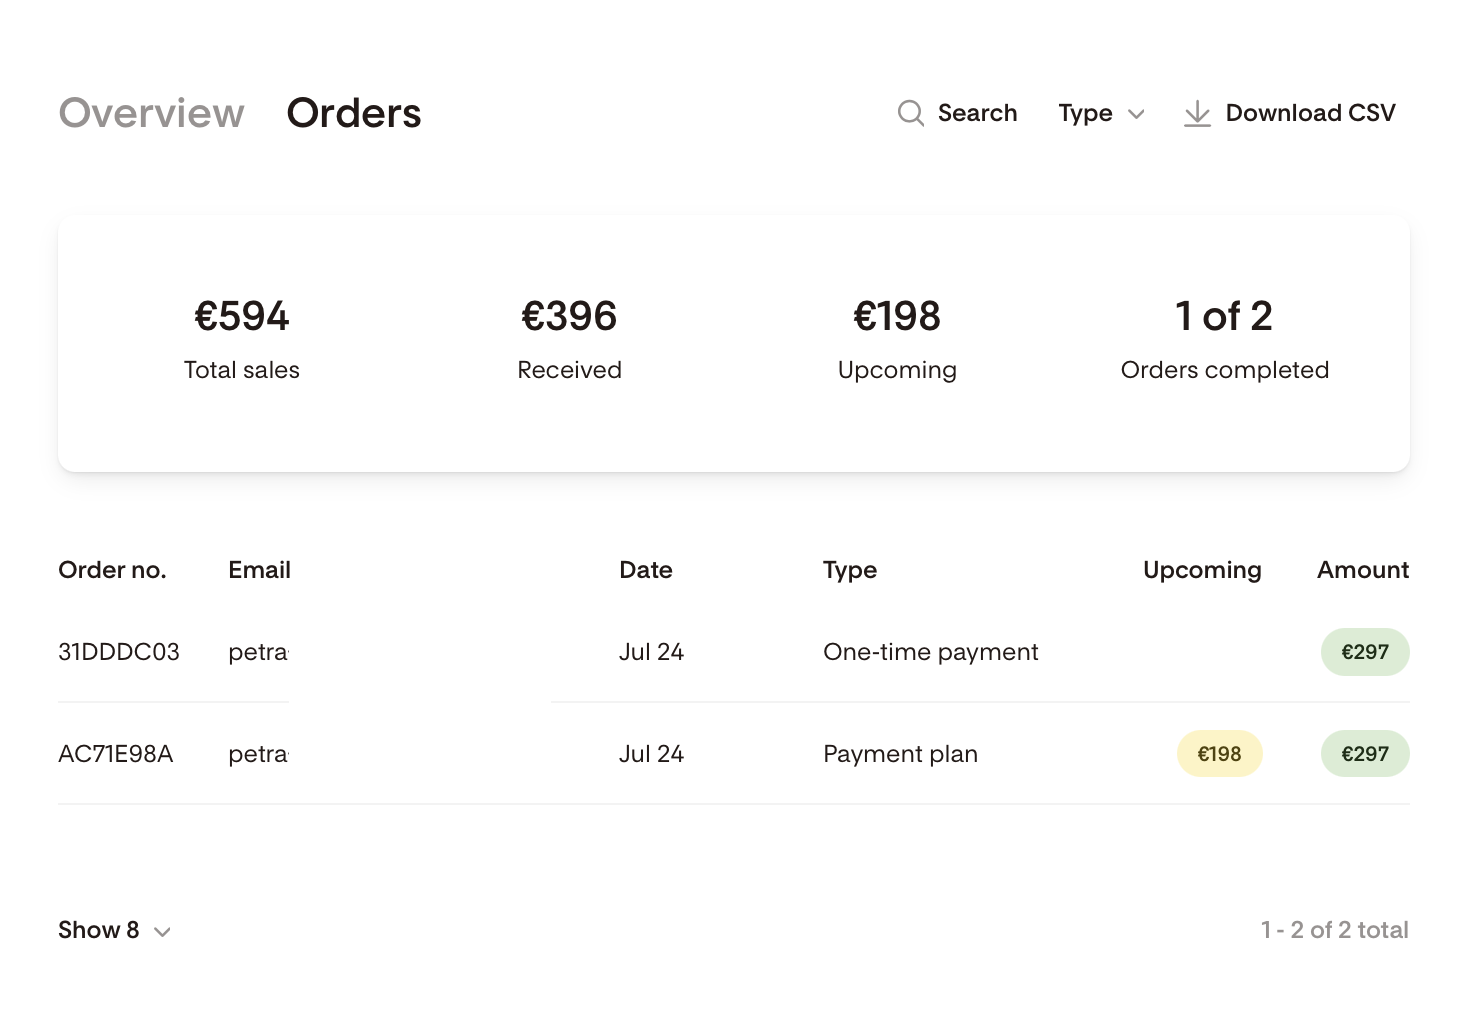
A full list of every order where this product was sold, whether as the primary product or as a bump offer. You can search by email address or order number and download the list as a CSV.
Each order row shows:
Order number
Buyer email
Transaction date
Payment type (one-time or payment plan)
Amount charged at the time of purchase
For payment plan orders, you'll also see the upcoming remaining amount still to be collected, plus a summary at the top of the tab showing total sales, amount received to date, and upcoming payments outstanding.
For subscription products
Tab 1: Overview
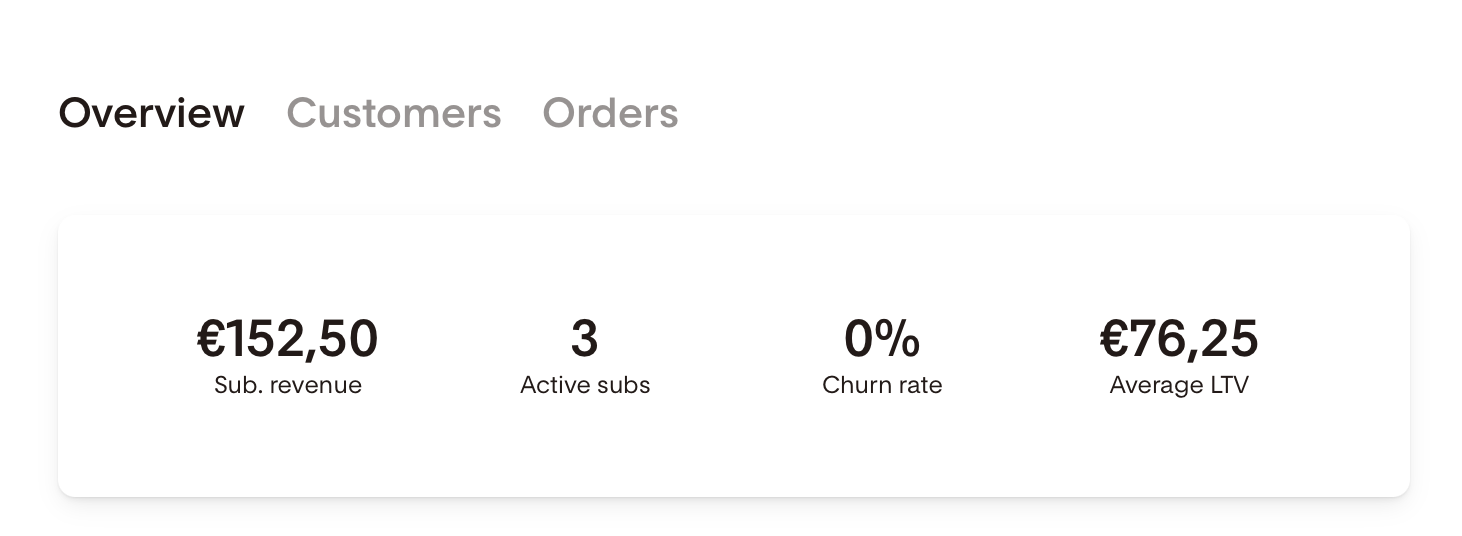
The overview tab shows subscription-specific metrics:
Subscription revenue (MRR, monthly recurring revenue, or ARR, annual recurring revenue)
Active customers
Churn rate
Average customer lifetime value (LTV)
All four include a delta vs. the prior period.
Below the hero metrics, you'll see:
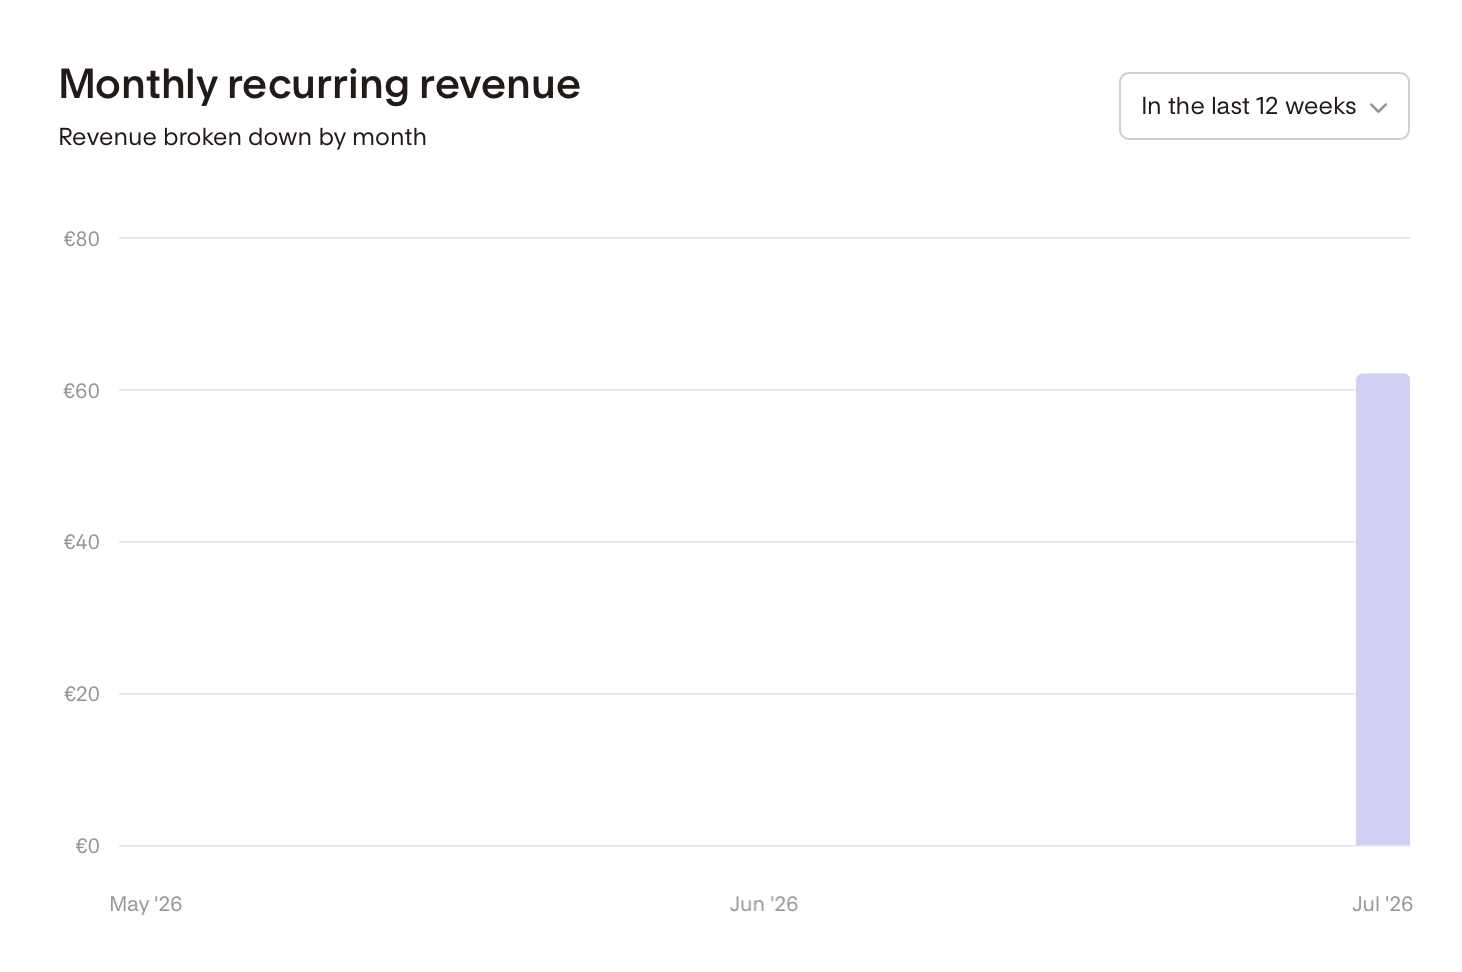
Monthly recurring revenue trend: A chart showing MRR over time, broken down by billing cadence.
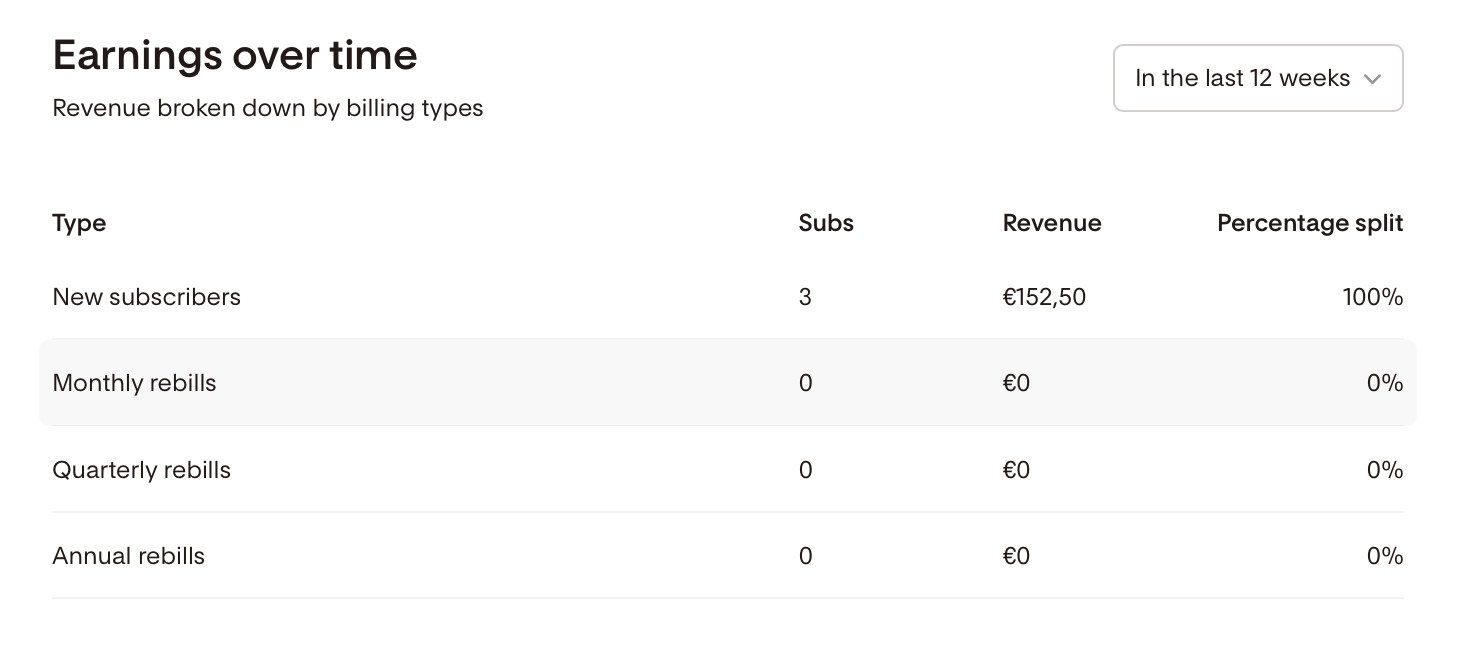
Earnings over time: Revenue broken down by subscriber type, including new subscribers and recurring rebills by cadence (monthly, quarterly, annual).
Tab 2: Customers
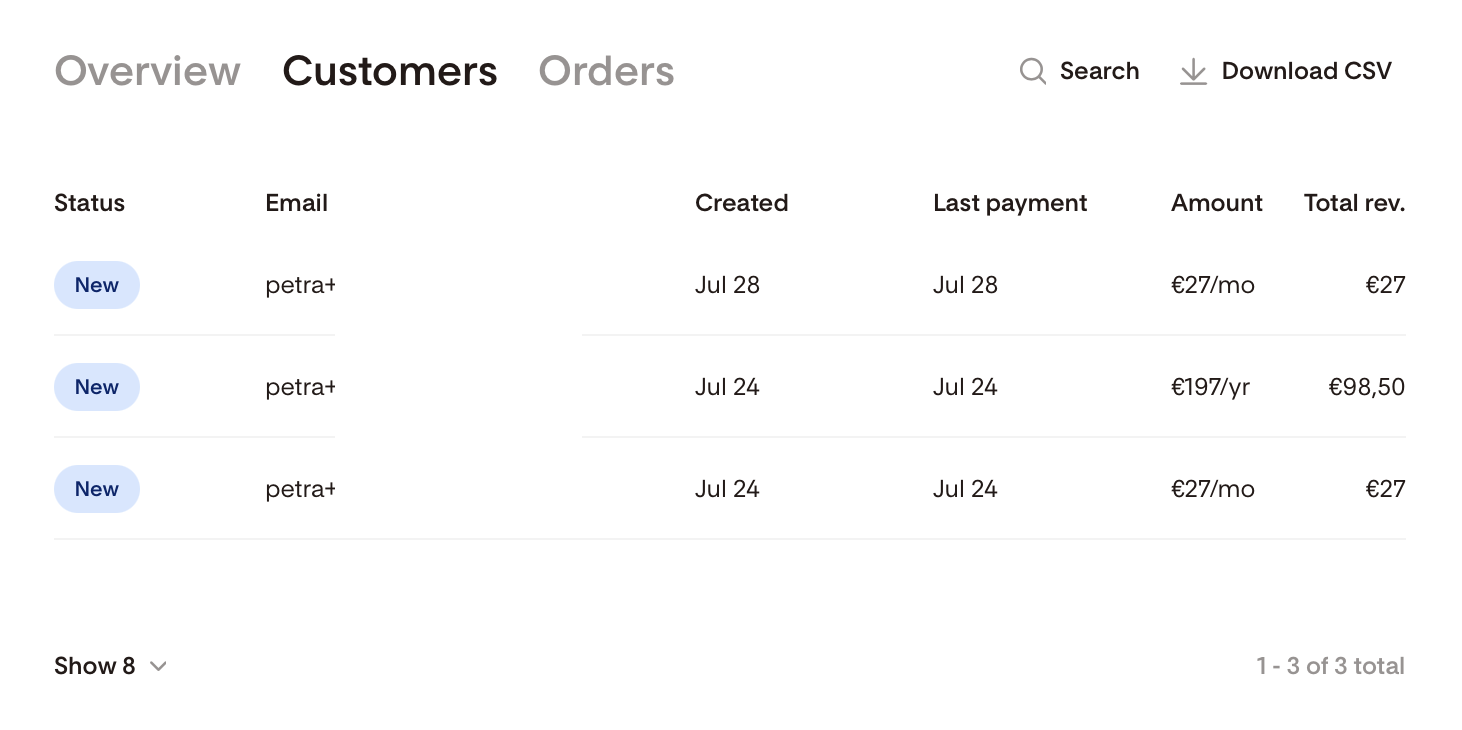
A full list of everyone who has purchased this subscription product. You can search by email, filter by status, and download as a CSV.
Each row shows:
Subscription status
Buyer email
Created: Date of first purchase
Last payment: Date of most recent successful payment
Recurring amount (with billing cadence)
Total revenue
Tab 3: Orders
A full list of every order where this product was sold. You can search by email address or order number and download the list as a CSV.
Each order row shows:
Order number
Buyer email
Transaction date
Amount charged at the time of purchase
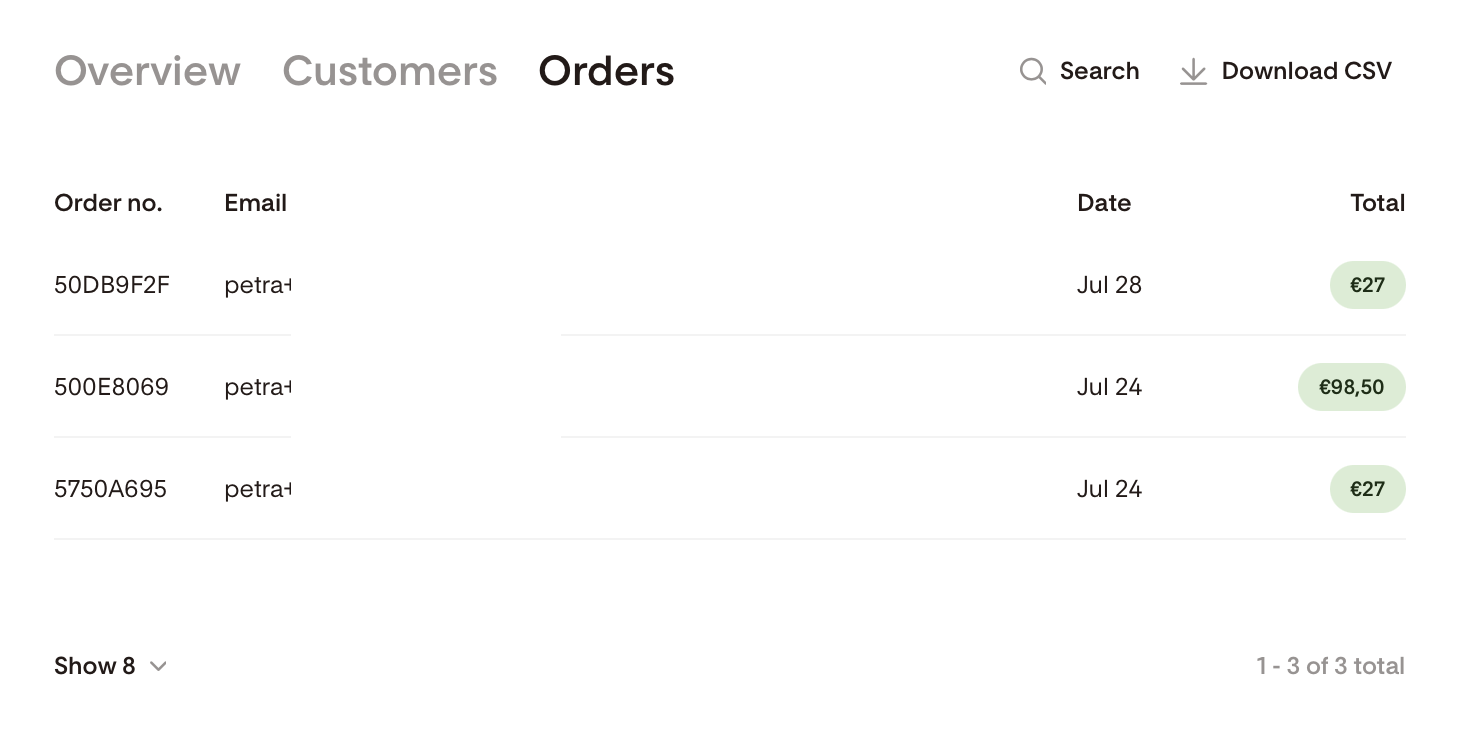
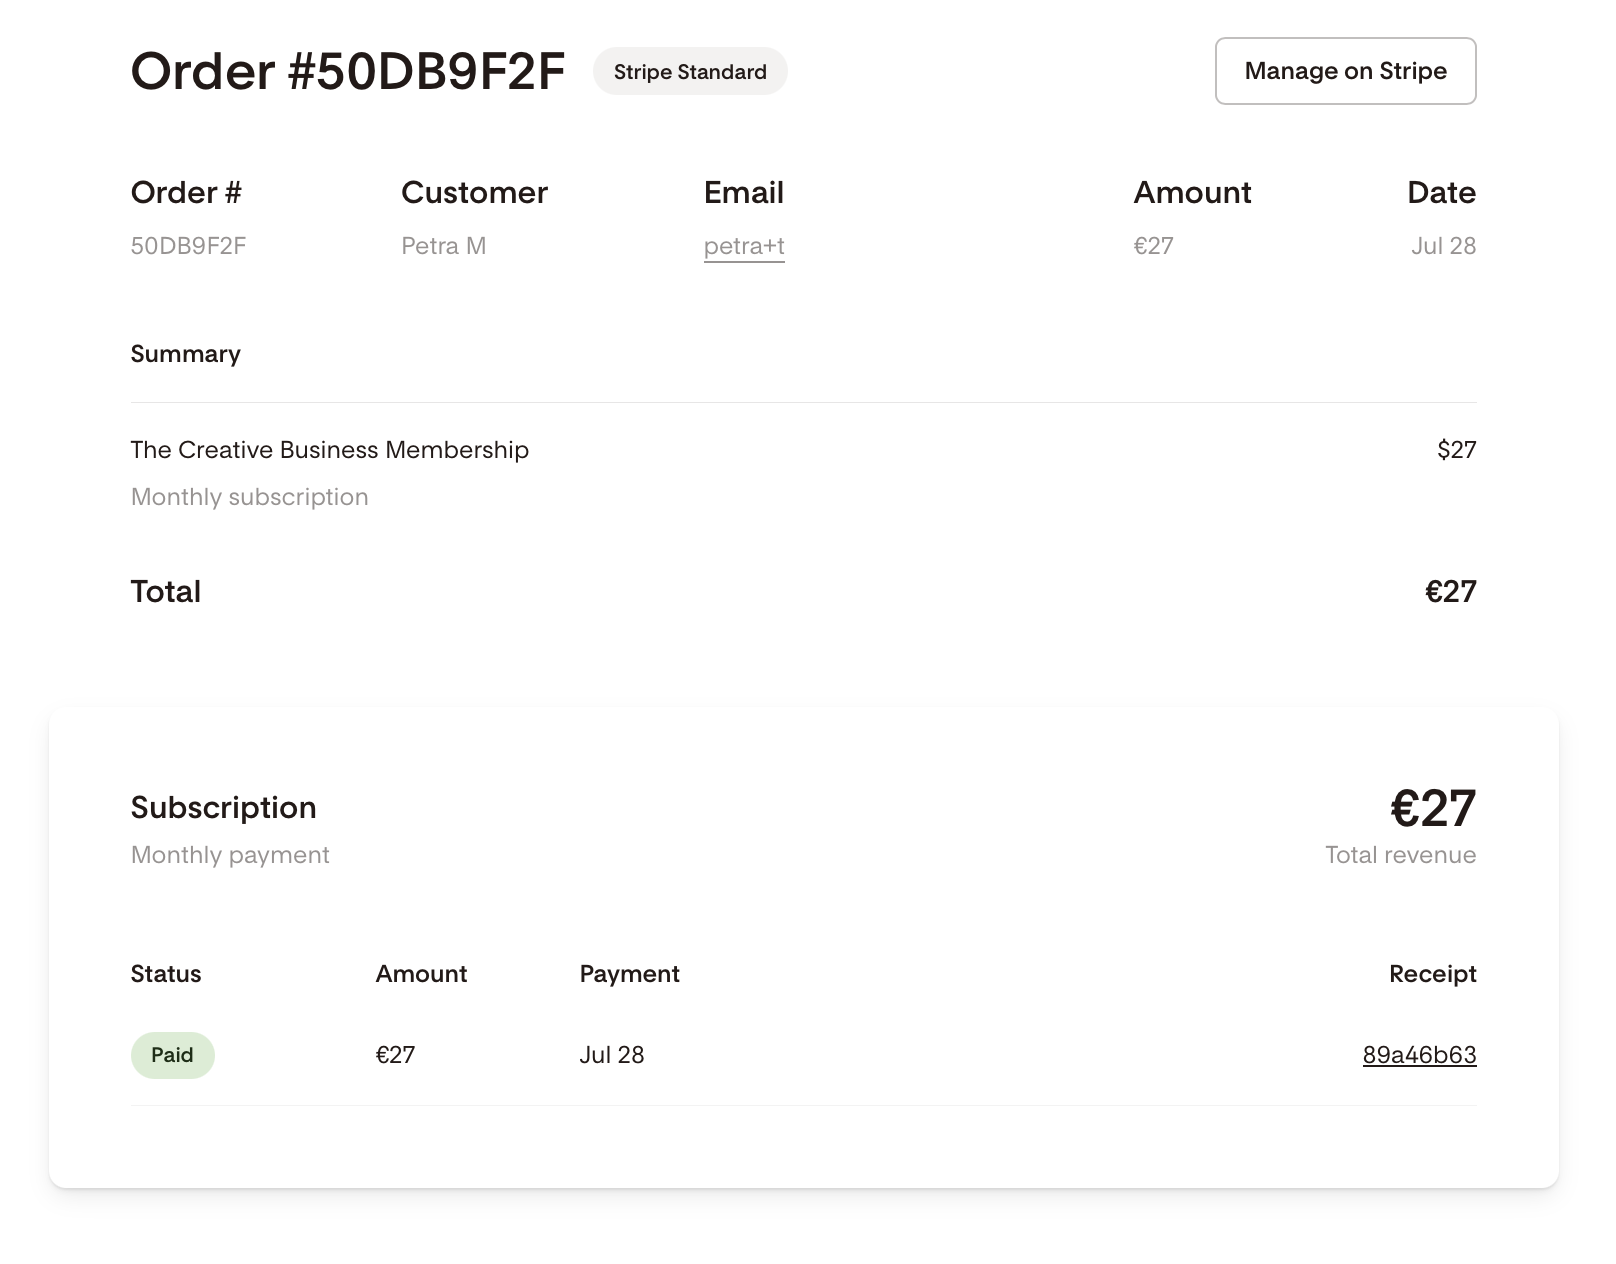
If you click on an order number or a buyer email address, you can see additional details about that order and click to manage the subscription on Stripe.
Legacy checkout analytics
If you published checkouts before the Product Catalog launched, your historical data is preserved exactly as it was. Nothing has been moved, changed, or removed.
How to access it:
From your Flodesk dashboard, click Analytics.
Select the Checkouts tab.
Note: The Checkouts tab only appears if you have at least one legacy checkout with recorded sales history, or a currently published legacy checkout. If you're new to Flodesk Checkout, this tab won't be visible.
How legacy and product analytics relate:
Legacy checkout analytics and product analytics are kept separate by default. Historical data from legacy checkouts won't automatically appear in Analytics > Products.
If you choose to migrate a legacy checkout to the new product catalog structure in the future (migration is coming in a later update), that checkout's historical analytics will move with it and become accessible in Analytics > Products. Until then, legacy data stays in the Checkouts tab, exactly where it's always been.
FAQ
Where do I find analytics for a product I'm selling as a bump offer?
Bump offer performance is included in the per-product detail view for both the primary product and the upsell product. In the Orders tab, every order where that product was sold (whether as a primary product or as an upsell) appears in the list.
Why can't I see the Checkouts tab in my Analytics?
The Checkouts tab only appears for members who have existing legacy checkout history or a currently published legacy checkout. If you started selling after the new Products launched and have never published a legacy checkout, you'll only see the Products tab.
Can I see all my revenue in one place?
If you have both legacy checkouts and new catalog products, your revenue is currently split between Analytics > Checkouts and Analytics > Products. A unified view isn't available by default until legacy checkouts are migrated to the new product structure.
How is conversion rate calculated?
Conversion rate is calculated as completed transactions divided by checkout page visitors. Where a sales page exists upstream, you'll also see a Stage 1 funnel showing sales page views to checkout clicks. The Stage 2 rate (checkout page views to completed payments) is always the core product-level metric.
Can I download my order data?
Yes. From the Orders tab of any product's detail view, you can download a CSV of all orders for that product. Subscription customer data can also be downloaded from the Customers tab.
Will my legacy checkout analytics disappear after migration?
No. If you choose to migrate a legacy checkout to the new product structure, your historical analytics move with it to Analytics > Products. Nothing is lost. Migration is always your choice and will never happen automatically.
Do sales page analytics include data from all products on that page?
Yes. The sales page analytics view shows a breakdown of every product on that page, including individual conversion rates and total sales per product. You can click through to any product's full detail view from there.